
How to Analyze a Stock: A Beginner's Step-by-Step Framework
Analyzing stocks can feel overwhelming when you are starting out. This step-by-step guide breaks down the process into six clear areas that any investor can learn, covering everything from understanding the business to evaluating the price you are paying.

On this page · 9 sections
Quick Answer: Analyzing a stock involves six key steps: understanding the business model, evaluating revenue growth, assessing profitability, examining the balance sheet, identifying competitive advantages, and determining if the valuation is reasonable. Each step builds on the last to create a complete investment picture.
Key takeaways
- Stock analysis answers two questions: is this a good business, and is the price fair?
- Start by understanding what the company sells, who its customers are and how it makes money.
- Check at least five years of revenue growth, then margins and free cash flow.
- A debt-to-equity ratio below 1.0 is generally comfortable; above 2.0 requires careful scrutiny.
- Sustained ROE above 15% with stable or expanding margins is the financial signature of a strong moat.
The Goal of Stock Analysis
The purpose of analyzing a stock is simple: determine whether the business is worth owning and whether the current price is a fair price to pay for it. You are essentially asking two questions. First, is this a good business? Second, is now a good time to buy it?
Many investors skip the first question and focus only on the second, looking for stocks that have recently dropped or seem "cheap." Others are so in love with a company that they ignore whether the price makes sense. Both approaches lead to poor outcomes. A complete analysis addresses both.
Step 1: Understand the Business
Before looking at a single number, spend time understanding what the company actually does. Read the company's website. Read the most recent annual report (10-K for US companies). Listen to or read the transcript of the most recent earnings call.
Ask yourself:
- What does this company sell? Products, services, or subscriptions?
- Who are their customers? Businesses (B2B) or consumers (B2C)?
- How does the company make money? What is the business model?
- How large is the total market? Is there room to grow?
- Why do customers choose this company over competitors?
Warren Buffett famously says he only invests in businesses he can understand. If you cannot explain clearly what the company does and why customers buy from them, that is a sign you need more research before investing.
Step 2: Evaluate Revenue Growth
The top line of the income statement is revenue, and it is where your quantitative analysis should start. A business growing its revenue consistently over several years is demonstrating that it is winning customers and expanding its market presence.
Look at revenue over at least the past five years. Calculate the compound annual growth rate (CAGR). Compare that growth rate to competitors in the same industry. Ask whether growth is accelerating or decelerating. Understand whether growth is organic (winning new customers) or driven by acquisitions.
Strong revenue growth of 10 to 20% or more per year is a very positive signal. Flat or declining revenue requires a specific explanation and clear recovery thesis before investing.
Real data · MSFT
Microsoft revenue, last 5 fiscal years
Annual, USD. Latest fiscal year ended June 30, 2026.
$331.8B
+13.7% a year since FY2022
| Fiscal year | revenue |
|---|---|
| FY2022 | $198.3B |
| FY2023 | $211.9B |
| FY2024 | $245.1B |
| FY2025 | $281.7B |
| FY2026 | $331.8B |
Step 3: Assess Profitability and Cash Flow
Revenue tells you how much business the company is doing. Profitability and cash flow tell you how much of that business is actually creating value for owners.
Key metrics to examine:
- Gross margin: Revenue minus cost of goods sold, as a percentage. High gross margins give the company more room to cover operating expenses and generate profit.
- Operating margin: How efficiently the company converts revenue to operating profit. Rising operating margins over time indicate operating leverage, a very positive sign.
- Net profit margin: The percentage of revenue that becomes bottom-line profit after all costs including interest and taxes.
- Free cash flow: The actual cash generated after capital expenditures. For many investors, this is the most reliable profitability measure.
Margins should be stable or improving. Declining margins while revenue grows suggest the company is buying growth at the expense of efficiency.
Step 4: Examine the Balance Sheet
The balance sheet shows you whether the company is financially strong enough to survive setbacks and fund its own growth.
Focus on:
- Cash position: How much cash does the company have? Is it growing?
- Debt levels: What is the total debt? How many years of operating income would it take to pay it off? A debt-to-equity ratio below 1.0 is generally comfortable; above 2.0 requires careful scrutiny.
- Current ratio: Current assets divided by current liabilities. Above 1.5 suggests the company can meet its short-term obligations comfortably.
- Debt trends: Is debt increasing or decreasing over time?
A company with minimal debt and a growing cash balance has maximum flexibility. It can invest in growth, acquire competitors, buy back shares, or pay dividends without asking shareholders for more money or taking on more risk.
Step 5: Evaluate the Competitive Advantage (Moat)
A business without a competitive moat will eventually see its profits competed away. Every investor should think carefully about why a company's current success is sustainable.
Common sources of moats include:
- Brand strength: Customers choose the product because of what the brand stands for, often allowing premium pricing
- Network effects: The product becomes more valuable as more people use it (social networks, payment systems)
- Switching costs: Customers face significant friction to leave, whether financial, operational, or psychological
- Cost advantages: Structural cost advantages that competitors cannot easily replicate
- Regulatory and patent protection: Legal barriers that limit competition
The financial signature of a strong moat is sustained high return on equity (above 15%) and stable or expanding profit margins over many years, even as competitors try to take market share.
Real data · Compare
Return on equity: AAPL, NVDA, KO, MSFT
Basis: trailing twelve months.
AAPL
Apple
137.2%
NVDA
Nvidia
110.1%
KO
Coca-Cola
43.0%
MSFT
Microsoft
33.2%
15% benchmark for a strong ROE
ROE is net income divided by shareholder equity: how much profit the company earns on the money owners have invested.
Step 6: Evaluate Valuation
Even the best business in the world can be a bad investment if you pay too much for it. The final step is determining whether the current price is reasonable given the company's fundamentals and growth prospects.
Key valuation metrics:
- P/E ratio: Price divided by earnings per share. Compare to the company's historical P/E and to peers.
- Price-to-free-cash-flow: Market cap divided by annual free cash flow. Similar to P/E but uses real cash rather than accounting earnings.
- Price-to-sales (P/S): Useful for companies not yet profitable.
- PEG ratio: P/E divided by earnings growth rate. Accounts for growth in the valuation.
A stock trading at a premium to its history or peers is not automatically overvalued, if the business quality or growth rate warrants it. A stock trading at a discount is not automatically cheap, if the discount reflects genuine deterioration.
Putting It All Together
Thorough stock analysis combines all six steps into a complete picture. No single metric or step should dominate the decision. A company can score extremely well on five criteria and poorly on one, and that one weakness might be a dealbreaker or it might be manageable. Context and judgment are essential.
Keeping notes on your analysis creates a written record that holds you accountable to your original thesis. If the thesis changes because the business changes, you can reassess. If the thesis holds but the stock price drops, you have the analytical foundation to decide whether to buy more or sell.
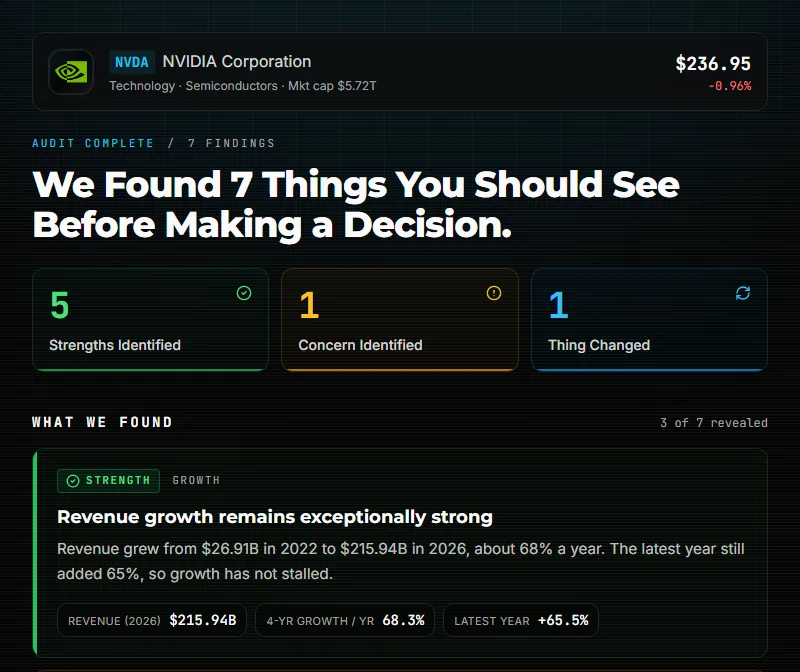
ChartEquity's Stock Audit runs through this exact framework automatically using real financial data, scoring each of the six dimensions and providing a composite grade to help you quickly identify where a company's strengths and weaknesses lie.
Frequently Asked Questions
How long does it take to analyze a stock?
A thorough first analysis of an unfamiliar company typically takes 2 to 4 hours for an experienced investor. For beginners, the first few analyses may take longer as you build familiarity with financial statements. The ChartEquity Stock Audit condenses the framework into minutes by automating the data gathering and scoring.
What financial statements do I need to analyze a stock?
The three core financial statements are the income statement (revenue and profits), the balance sheet (assets, liabilities, equity), and the cash flow statement (actual cash movements). All three are available in every public company's quarterly (10-Q) and annual (10-K) filings with the SEC.
How do I know if a stock is undervalued or overvalued?
Compare the company's current P/E, P/S, and price-to-free-cash-flow ratios to its own 5-year historical averages and to direct competitors in the same industry. A stock trading below its historical valuation range without a fundamental reason for the discount may be undervalued.
What is the most important thing to look for when analyzing a stock?
Most professional investors prioritize the competitive moat: the sustainable advantage that protects profits from competition. A business with a genuine moat can sustain high returns on equity for decades. Revenue growth and profitability are important, but they are far more durable when protected by a real competitive advantage.
What is fundamental analysis vs technical analysis?
Fundamental analysis evaluates a company's financial health, competitive position, and intrinsic value based on financial data. Technical analysis studies historical price patterns and trading volume to predict future price movements. Most long-term investors rely primarily on fundamental analysis; traders often use technical analysis for timing.