
Know what's moving the market, minus the noise
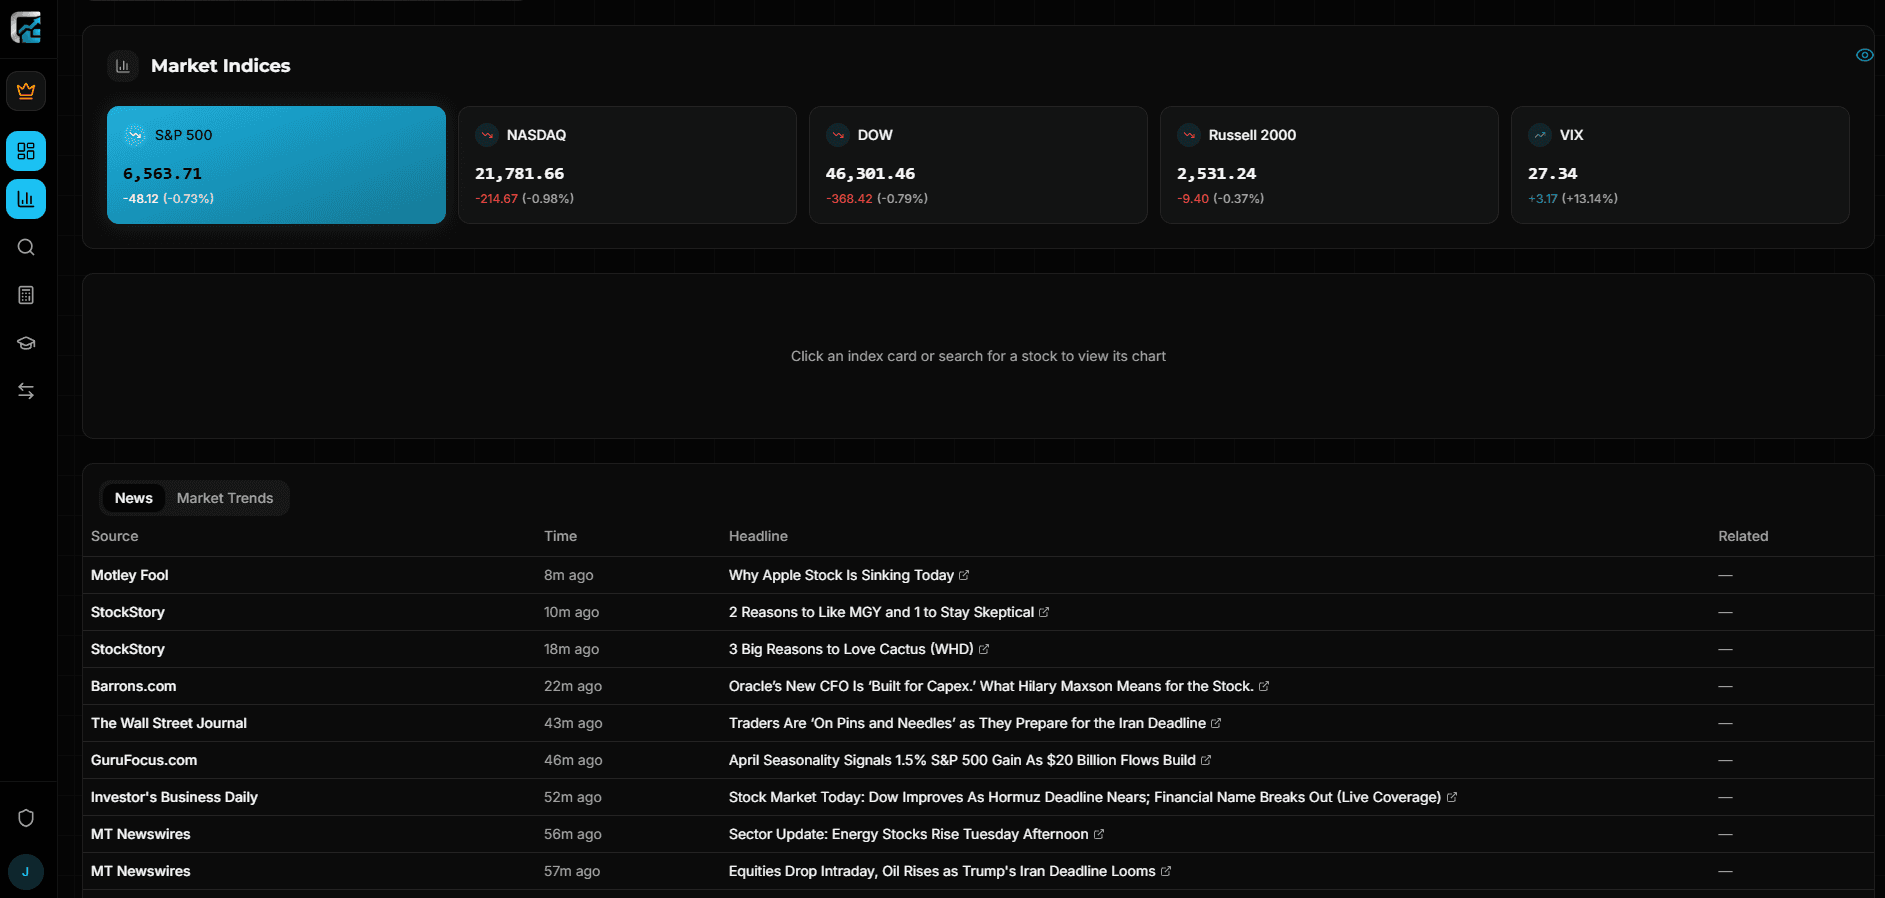
If you're hopping between five sites to figure out what the market did today, you don't have to. Our free market dashboard puts live index prices, the day's headlines and the biggest movers on one screen, so you can get your bearings fast and get back to research.
- Live indices and headlines, no account needed
- Charts with a free account
- Top gainers, losers and most active
What you get for free
Context first, then decisions
A stock dropping 3% means one thing on a calm day and something else when the whole market's down. This is the page you check first, so you know which kind of day it is.
Live index prices
The S&P 500, Nasdaq, Dow, Russell 2000 and the VIX, side by side.
Charts in one click
With a free account, tap any index to chart it and switch the time range to see the bigger trend.
One headline feed
The day's market stories from major financial outlets, newest first, in one list.
Today's movers
Top gainers, top losers and the most active stocks, so you can see where the action is.
How it works
From headline to a real answer
News tells you what happened. Research tells you if it matters to you. Here's how to get from one to the other.
- 1
Check the market
Open the dashboard and see how the indices are doing today. - 2
Read the story
Scan the headlines and the top movers to see what's driving the day. - 3
Research the company
Spot a stock you care about? Look it up in the Stock Analyzer to see the business behind the headline.
Want to track your own stocks too?
The free dashboard covers the market. Pro covers your market: the stocks you own and the ones you're watching.
- Extended-hours (pre- and post-market) charts
- Watchlists for up to 100 stocks
- Portfolio tracking
Prefer to read? Our market analysis articles break down the biggest stories with real numbers.