Constellation Brands Earnings Beat as Margins Slip
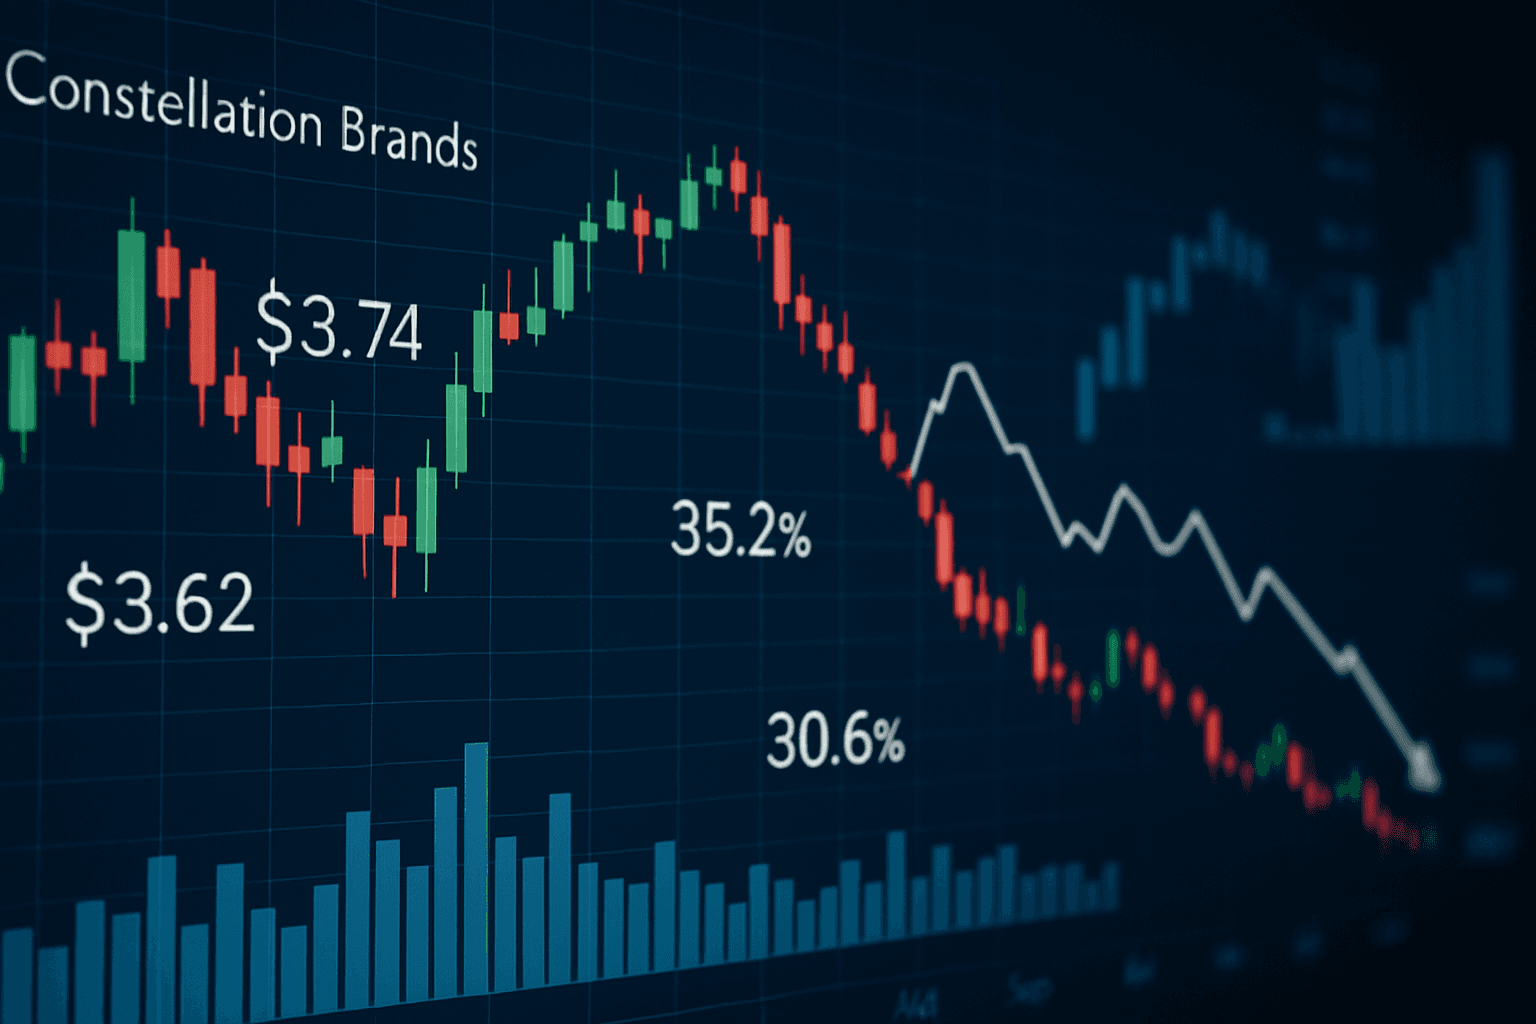
Constellation Brands beat Q2 EPS estimates at $3.74 vs $3.62, but operating margin fell to 30.6% from 35.2%. Here's what the report means for STZ.

On this page · 6 sections
Quick Answer: Constellation Brands reported fiscal second-quarter results on Tuesday, October 6, 2026, after the market close, posting adjusted EPS of $3.74 against a $3.62 consensus, its 5th straight beat. Revenue rose 6.1% to $2.63 billion, but operating margin fell to 30.6% from 35.2% a year earlier, so the beat came with a margin problem attached.
Key takeaways
- Constellation Brands earned $3.74 per share in Q2 FY2027, beating the $3.62 consensus by 3.3% for its 5th straight quarter at or above estimates.
- The beats keep shrinking: the surprise was 16.3% in the report on January 7, 2026, and it's gotten smaller in every report since.
- Revenue grew 6.1% to $2.63 billion, but operating income fell to $805.0 million from $874.0 million as operating margin dropped to 30.6%.
- The shares rose 2.4% to $118.39 on Wednesday, October 7, 2026, and still trade at 10.6x trailing earnings after a 19.1% drop over 52 weeks.
Constellation Brands reported fiscal second-quarter results on Tuesday, October 6, 2026, after the market close, and beat Wall Street's earnings estimate for the 5th quarter in a row. Adjusted EPS came in at $3.74 against a $3.62 consensus, and the stock rose 2.4% the next day. But this was the smallest beat of the last four reports, and the margin line went the wrong way.
That second part is why the story didn't end with the beat. Investing.com reported on October 8 that RBC Capital lowered its price target on the stock, citing margins, and HSBC downgraded the shares to Hold from Buy on October 8, 2026. If you're researching the beer company this week, the question isn't whether it beat. It's what that beat cost.
Did Constellation Brands beat earnings estimates?
Yes. Constellation Brands reported adjusted EPS of $3.74 for the quarter ended August 31, 2026, against a consensus estimate of $3.62, a beat of $0.12 or 3.3%. That makes 5 straight quarters at or above the consensus. But the size of the beat has now shrunk in each of the last four reports.
Look at the path. The surprises go from double digits to low single digits in under a year.
| Report date | EPS actual | Consensus | Surprise |
|---|---|---|---|
| January 7, 2026 | $3.06 | $2.63 | +16.3% |
| April 8, 2026 | $1.90 | $1.71 | +11.1% |
| June 30, 2026 | $3.43 | $3.22 | +6.5% |
| October 6, 2026 | $3.74 | $3.62 | +3.3% |
A shrinking surprise can mean two things. Analysts got better at modeling the company, or the business stopped outrunning expectations by as much. The margin numbers below lean toward the second. There's also a gap between adjusted and reported results: GAAP diluted EPS was $3.32, so $0.42 per share of the headline number comes from adjustments. If the difference between those two figures is fuzzy, our guide to earnings per share and how to use it walks through it.
How did Constellation Brands stock react?
The shares rose 2.4% on Wednesday, October 7, 2026, the first session after the report, going from a $115.67 close on October 6 to $118.39. As of the close on Wednesday, October 7, 2026, that's still about 29% below the stock's highest close of the past year.
It wasn't a straight line up. Barron's ran a piece on October 7 titled "The Number That Explains Why Constellation Brands Stock Is Down After Earnings," and Bloomberg's Stock Movers segment that day also had the stock down, yet the session closed higher. Then on October 8, Investing.com asked "Why is Constellation Brands stock sliding today?" That session hasn't closed in the prices used here, so the $118.39 close is the latest firm number.
The bigger frame: the highest close in the past 12 months was $166.68 on February 4, 2026, and the lowest was $112.77 on September 29, 2026, just a week before the report. That low came right before results, so the stock went into earnings near the bottom of its yearly range.
Over 52 weeks the stock is down 19.1% while the S&P 500 gained 15.8%. One good session doesn't change that gap.
What changed versus a year ago?
Sales grew but operating profit shrank. Revenue rose 6.1% to $2.63 billion, while operating income fell 7.9% to $805.0 million. So the company sold more but kept less of each dollar as profit, which is the opposite of what you'd want to see from a quarter with rising sales.
Operating margin dropped from 35.2% to 30.6%, a 4.6-point slide, according to the company's quarterly results.
| Metric | Q2 FY2026 | Q2 FY2027 |
|---|---|---|
| Revenue | $2.48 billion | $2.63 billion |
| Gross margin | 52.8% | 52.9% |
| Operating income | $874.0 million | $805.0 million |
| Operating margin | 35.2% | 30.6% |
| Net income | $466.0 million | $565.8 million |
| GAAP diluted EPS | $2.65 | $3.32 |
Now look at where the pressure sits. Gross margin barely moved, 52.9% versus 52.8%, so the cost of making and shipping the product isn't the issue. The squeeze happened between gross profit and operating income, which is operating expenses. StockStory's October 8 recap was titled "Marketing Spend, Portfolio Expansion Fuel Growth, Margin Pressures Remain," which fits that pattern.
It's also a sequential slip, not just a year-over-year one. Operating margin was 34.7% in Q1 FY2027, so it gave up 4.1 points in a single quarter even as revenue rose 8.2% from Q1.
Then there's net income, up 21.4% to $565.8 million. That's a nice headline, but with operating income down, the gain came from below the operating line. The summary income statement doesn't break out what drove it, so it's hard to treat as a repeatable improvement. For a refresher on reading those lines, see our plain-English guide to the income statement.
The chart below covers five fiscal years of revenue. Watch for the dip in the most recent year; that's the hole this quarter's growth is climbing out of.
Real data · STZ
STZ revenue, last 5 fiscal years
Annual, USD. Latest fiscal year ended February 28, 2026.
$9.1B
+0.9% a year since FY2022
| Fiscal year | revenue |
|---|---|
| FY2022 | $8.8B |
| FY2023 | $9.5B |
| FY2024 | $10.0B |
| FY2025 | $10.2B |
| FY2026 | $9.1B |
What does this quarter mean for the bigger picture?
It's a step back toward growth after a rough year, but the long-run trend is flat. Revenue fell 10.5% to $9.14 billion in FY2026, and the compound annual growth rate from FY2022 to FY2026 was just 0.9%. A 6.1% quarter is a better direction, not yet a new trend.
GAAP profit has been noisy. The company posted net losses in FY2022, FY2023 and FY2025, with profits of $1.73 billion in FY2024 and $1.69 billion in FY2026. That swing between losses and profits makes reported earnings a shaky guide to how the business is actually doing year to year.
Cash flow is the steadier read: free cash flow was $1.79 billion in FY2026, a 19.6% margin, close to the $1.68 billion it generated in FY2022.
The balance sheet carries real debt. Total debt was $10.32 billion in the latest quarter against $98.5 million in cash, down from $11.20 billion at the end of FY2026. So the company holds very little cash against a large debt load, though it's been paying that load down.
Debt-to-equity was 1.39 at fiscal year-end. That would be heavy for a cash-burning startup, but for a consumer staple throwing off close to $1.8 billion a year in free cash flow, it's manageable, and it's moving the right way. Our guide to the debt-to-equity ratio explains how to judge that.
Valuation is where the market's skepticism shows. As of the close on Wednesday, October 7, 2026, the stock trades at 10.6x trailing earnings, 9.7x forward earnings and 6.2x EV/EBITDA, with a 3.48% dividend yield. Those are low multiples for a steady consumer name, which tells you investors are pricing in real doubt.
Analysts are more upbeat than the price: 23 analysts have an average target of $153.91, and most of them rate it Buy or Hold. The compare below puts the P/E next to two other consumer names so you can see how wide the discount runs.
Real data · Compare
P/E ratio: WMT, KO, STZ
Basis: trailing twelve months.
WMT
Walmart
42.9x
KO
Coca-Cola
28.2x
STZ
STZ
11.8x
P/E is share price divided by the last twelve months of earnings per share: how many dollars investors pay for $1 of profit.
Real data · Compare
P/E ratio: WMT, KO, STZ
Basis: trailing twelve months.
WMT
Walmart
42.9x
KO
Coca-Cola
28.2x
STZ
STZ
11.8x
P/E is share price divided by the last twelve months of earnings per share: how many dollars investors pay for $1 of profit.
A single-digit forward multiple usually means investors doubt the earnings will hold. The numbers either back that doubt or they don't, and the margin trend is the swing factor. Our explainer on what the P/E ratio really tells you covers why cheap and safe aren't the same thing.
To see how debt, cash flow, valuation and margin trends score together, the free Stock Audit for STZ pulls them into one view.
What's next for Constellation Brands?
The company hasn't confirmed its next earnings date yet, and no upcoming ex-dividend date has been announced; the most recent was Thursday, July 30, 2026. Until then, three numbers decide whether this beat holds up: operating margin, revenue growth and the size of the EPS surprise.
Operating margin
The test is whether 30.6% is a floor or a new normal. A move back toward the 34.7% posted in Q1 would suggest the spending was a one-quarter push. Another quarter near 30% would back up the margin worries that drove RBC's target cut.
Revenue growth
After a 10.5% decline in FY2026, the 6.1% gain needs company. Yahoo Finance's October 7 headline framed it as beer demand facing a "durability question," and that's the right question.
The beat streak
The surprise has gone from 16.3% to 3.3% in four reports. At that pace, the 5-quarter streak has very little cushion left.
Related Reading
- Free Cash Flow Explained: What It Is and Why It's the Metric Investors Trust Most
- What Is a Moat? Warren Buffett's Favorite Investment Concept Explained
- Growth Investing vs Value Investing: What's the Difference and Which Works Better?
- The 30-Minute Stock Audit: A Framework for Quickly Evaluating Any Stock
Frequently Asked Questions
Why did analysts cut targets after Constellation Brands beat earnings?
Because the beat came alongside weaker margins. Investing.com reported on October 8 that RBC Capital lowered its target citing margins, and HSBC moved to Hold from Buy the same day. Even so, the 23 analysts with targets still average $153.91, with a range running from $99.00 at the low end to $209.00 at the high end, a wide spread that shows real disagreement.
Does Constellation Brands pay a dividend?
Yes. The yield was 3.48% as of the close on October 7, 2026, and the most recent ex-dividend date was July 30, 2026. In FY2026 the company paid $715.7 million in dividends while generating $1.79 billion of free cash flow, so the payout was covered about 2.5 times by cash the business actually produced.
Is Constellation Brands stock cheap right now?
On multiples, it looks inexpensive: 9.7x forward earnings based on a forward EPS estimate of $12.20, 2.2x sales and a 3.5% free cash flow yield. But low multiples often reflect doubts about growth, and revenue fell 10.5% in FY2026. Whether it's cheap or fairly priced depends on whether margins and sales growth hold up.
Has Constellation Brands been buying back stock?
Yes. Diluted share count dropped from 190.4 million in FY2022 to 175.6 million in FY2026, about 7.8% fewer shares. The company spent $924.1 million on buybacks in FY2026 alone. Fewer shares means each remaining share claims more of the profit, which helps EPS grow faster than net income over time.
What does it mean that insiders own 12.6% of Constellation Brands?
Insiders hold 12.6% of the shares, a meaningful stake for a company with a $20.22 billion market value. Large insider ownership generally means management and founding shareholders feel the stock's moves directly. Institutions hold 88.5%, and short interest sits at 5.7% of the float, so most of the bearish positioning is moderate rather than extreme.