
Market Capitalization Explained: Large Cap, Mid Cap, and Small Cap Stocks
Market cap is the total value the stock market places on a company. Understanding the difference between large cap, mid cap, and small cap stocks helps you build a more diversified portfolio and set the right expectations for risk and return.

On this page · 7 sections
Quick Answer: Market capitalization is the total market value of a company's outstanding shares, calculated by multiplying the stock price by the number of shares. Large-cap stocks exceed $10 billion, mid-caps range from $2 to $10 billion, and small-caps fall below $2 billion.
Key takeaways
- Market cap is the stock price multiplied by shares outstanding: what the market values a company's equity at today.
- Mega caps exceed $200 billion, large caps run $10 billion to $200 billion, mid caps $2 billion to $10 billion and small caps $300 million to $2 billion.
- Smaller companies tend to be more volatile, less liquid and covered by fewer analysts.
- Small caps have outperformed over very long periods, but that premium has been uneven.
- Enterprise value adds debt and subtracts cash, which helps when comparing companies with different debt levels.
What Is Market Capitalization?
Market capitalization, almost universally shortened to "market cap," is the total market value of a company's outstanding shares of stock. It is calculated by multiplying the current stock price by the total number of shares outstanding.
Market Cap = Stock Price x Shares Outstanding
If a company has 100 million shares outstanding trading at $50 each, its market cap is $5 billion. If the stock price rises to $60, the market cap increases to $6 billion. The calculation is that straightforward.
Market cap is not the same as the company's intrinsic value or what someone would pay to acquire it. It is simply what the collective market is willing to value the company's equity at on any given day.
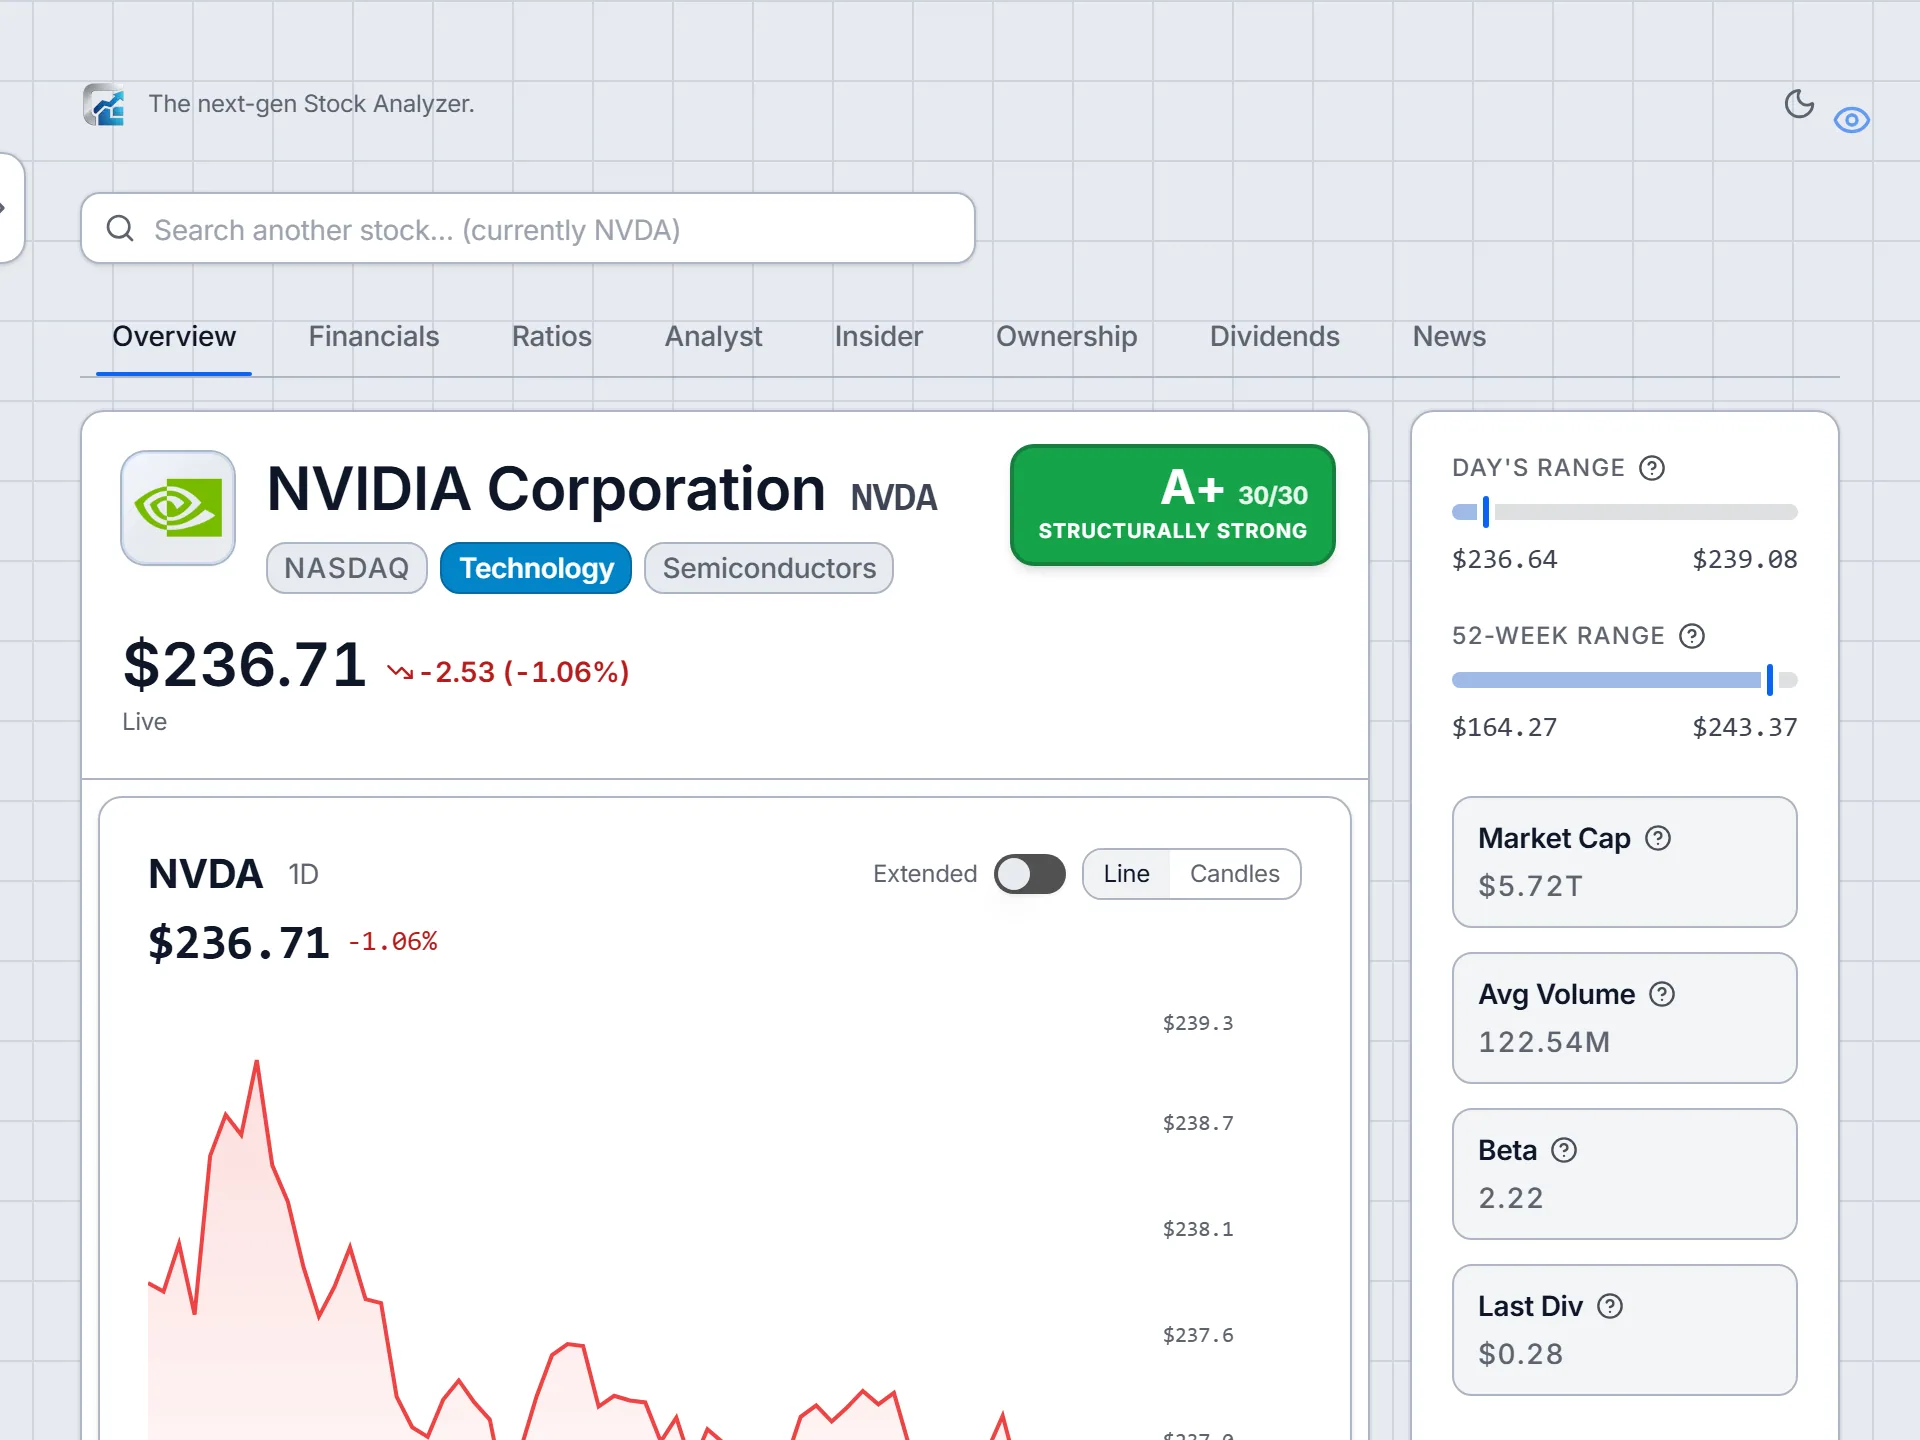
The Market Cap Categories
Investors and financial professionals classify stocks into categories based on their market cap. The exact thresholds vary slightly by source, but the general framework is widely used:
Mega-cap: Over $200 billion. The world's largest companies including Apple, Microsoft, Alphabet (Google), Amazon, and NVIDIA. These companies are so large that their movements can influence entire indexes.
Large-cap: $10 billion to $200 billion. Established, well-known companies that are leaders in their industries. Most companies in the S&P 500 index fall into this category.
Mid-cap: $2 billion to $10 billion. Companies that have moved past the startup phase and have established business models, but still have significant room for growth. Often a sweet spot that combines relative stability with meaningful growth potential.
Small-cap: $300 million to $2 billion. Smaller, often younger companies. Can offer higher growth potential but also carry higher risk, lower liquidity, and less analyst coverage.
Micro-cap: $50 million to $300 million. Very small companies with limited resources, thin trading volume, and significant risk. Require much more careful due diligence.
Nano-cap: Under $50 million. Extremely small and speculative. Generally not appropriate for most investors without deep research capabilities.
Real data · Compare
Market capitalization: NVDA, AAPL, GOOGL, MSFT, AMZN, KO
Basis: current.
NVDA
Nvidia
$5.2T
AAPL
Apple
$5.0T
GOOGL
Alphabet
$4.1T
MSFT
Microsoft
$3.9T
AMZN
Amazon
$2.7T
KO
Coca-Cola
$404.0B
Market cap is share price times shares outstanding: what the market values the whole company at today.
Why Market Cap Matters for Your Portfolio
Market cap is not just a number. It carries real implications for the risk, return potential, and behavior of your investment.
Liquidity: Large-cap stocks trade millions of shares per day. You can buy or sell large amounts without meaningfully moving the price. Small-cap and micro-cap stocks trade far fewer shares, meaning large orders can significantly impact the price. For most individual investors this is not an issue, but it is important to understand.
Volatility: Smaller companies tend to be more volatile. A piece of negative news can drop a small-cap stock 20 to 30% in a single day. Large-cap stocks are more heavily owned by institutional investors with diversified mandates, which tends to dampen extreme volatility.
Analyst coverage: Apple might be covered by 50 or more Wall Street analysts. A $500 million small-cap company might have zero or one analyst covering it. Less coverage means less information available to the public, which can create opportunities for investors willing to do their own research.
Growth potential: It is mathematically easier for a $500 million company to double in size than for a $500 billion company to do the same. Large-cap companies must move enormous amounts of revenue to show meaningful percentage growth. Small-cap companies need much less.
Historical Returns by Market Cap
Historically, small-cap stocks have outperformed large-cap stocks over very long periods. Research going back to 1926 shows that small-cap stocks have delivered higher average annual returns than large-caps, though with significantly more volatility along the way.
This "small-cap premium" is well documented but often misapplied. It only materializes clearly over decades-long holding periods, and there are extended stretches, sometimes lasting years or more, where large-cap stocks dramatically outperform small-caps.
From 2010 to 2020, large-cap technology companies dominated, with companies like Apple, Amazon, and Microsoft delivering returns that crushed small-cap indexes. This does not mean small-caps will underperform forever, but it illustrates that the long-run premium can be very uneven in the short run.
How to Think About Market Cap in Your Investment Strategy
Most financial advisors recommend building a diversified portfolio that includes exposure across multiple market cap categories. This is often achieved through index funds or ETFs that track indexes like:
- The S&P 500 (large-cap focus)
- The Russell 2000 (small-cap focus)
- The Russell 1000 (large-cap)
- Total stock market funds (all sizes)
For individual stock pickers, market cap helps set appropriate expectations:
- Buying a large-cap company at fair value: expect market-rate returns unless you can identify a specific catalyst for outperformance
- Buying a small-cap with strong fundamentals and a long growth runway: the potential returns can be multiples of the market, but so can the risk of loss
- Buying a mega-cap that is well-understood by thousands of analysts: the bar for finding genuine mispricing is extremely high
Enterprise Value vs. Market Cap
Market cap is equity value only. Enterprise value (EV) is a more complete measure of what a company is worth, factoring in debt and cash.
Enterprise Value = Market Cap + Total Debt - Cash and Equivalents
Two companies with the same market cap but very different debt levels are not equally priced for acquisition purposes. The company carrying $2 billion in debt has $2 billion more in total claims that must be paid. Enterprise value captures this, which is why professional analysts often use EV-based ratios like EV/EBITDA instead of price-based ratios for comparisons.
For most individual investors analyzing publicly traded stocks, market cap is sufficient context. But if you are comparing two companies with meaningfully different debt levels, switching to enterprise value gives a more apples-to-apples comparison.
Frequently Asked Questions
What is the difference between market cap and stock price?
Stock price is the cost of a single share. Market cap is the total value of all shares combined. A company with a $10 stock price and 1 billion shares outstanding has a $10 billion market cap. Market cap is more meaningful than price alone because it reflects the total size of the company.
Is a higher market cap better for investors?
Not necessarily. Larger market caps generally mean less volatility and more liquidity, but also lower growth potential. Smaller companies have more room to grow but carry higher risk. The right market cap range depends on your investment goals and risk tolerance.
How does market cap differ from enterprise value?
Market cap is the value of equity only. Enterprise value (EV) adds long-term debt and subtracts cash to represent the total acquisition cost of the business. Two companies with the same market cap but different debt levels have very different enterprise values. EV is more useful for comparing companies with varying capital structures.
Can market cap change without a change in shares outstanding?
Yes. Market cap changes every time the stock price moves, since market cap equals price times shares. If a company's stock price rises 10%, its market cap rises 10% even if no new shares were issued or bought back.
What market cap is considered a blue-chip stock?
Blue-chip stocks are typically large-cap or mega-cap companies with market capitalizations above $10 billion, strong brand recognition, stable earnings histories, and often a long dividend track record. Examples include companies in the Dow Jones Industrial Average and the S&P 500's top 50 holdings.