
What Is Beta? Understanding Stock Volatility and Market Risk
Beta measures how much a stock tends to move relative to the overall stock market. Understanding beta helps investors match their portfolio's risk level to their own comfort with volatility and investment timeline. Here is what beta means and how to use it.

On this page · 7 sections
Quick Answer: Beta measures how much a stock tends to move relative to the overall stock market. A beta of 1.0 means the stock moves in line with the market. A beta of 1.5 means it tends to move 50% more, both up and down. A beta below 1.0 means the stock is less volatile than the market.
Key takeaways
- Beta measures how much a stock tends to move relative to the overall market, usually the S&P 500.
- A beta of 1.0 moves with the market, 1.5 tends to move 50% more in either direction, and below 1.0 is less volatile.
- Semiconductor and small-cap technology stocks tend to have high betas; utilities and consumer staples tend to have low betas.
- Beta is backward-looking and measures price volatility, not business quality.
- The longer your time horizon, the less beta should drive your decisions.
A Simple Definition of Beta
Beta is a statistical measure of how much a stock's price moves relative to the overall stock market, usually measured against the S&P 500 index.
The market itself always has a beta of 1.0 by definition. A stock with a beta of 1.0 tends to move in the same direction and by approximately the same amount as the market. A stock with a beta of 1.5 tends to move 50% more than the market in either direction. A stock with a beta of 0.5 tends to move about half as much.
Put simply:
- Beta > 1.0: More volatile than the market
- Beta = 1.0: Moves with the market
- Beta < 1.0: Less volatile than the market
- Beta < 0: Historically moves opposite to the market (rare)
How Beta Is Calculated
Beta is calculated using regression analysis comparing a stock's historical returns to the market's historical returns over a defined period, typically 3 to 5 years using monthly or weekly data.
You do not need to calculate beta yourself. It is displayed on most financial data platforms including Yahoo Finance, Bloomberg, and ChartEquity's stock analyzer. However, understanding what it represents helps you use it correctly.
The mathematical result is the slope of the regression line between the stock's returns and the market's returns. A slope of 1.5 means that for every 1% the market moved, the stock tended to move 1.5% in the same direction.
Real-World Examples of Beta
High beta stocks (above 1.5):
- Small-cap technology companies
- Semiconductor stocks
- Biotech companies awaiting drug approvals
- Meme stocks and highly speculative names
These stocks can generate enormous gains in bull markets but fall sharply in corrections.
Near market beta (0.8 to 1.2):
- Large-cap technology companies
- Consumer discretionary companies
- Industrial stocks
These stocks roughly track the market's overall movements.
Low beta stocks (under 0.7):
- Utility companies
- Consumer staples (food, beverages, household products)
- Healthcare companies
- Real estate investment trusts
These stocks are more stable and defensive, often sought during market downturns.
Real data · Compare
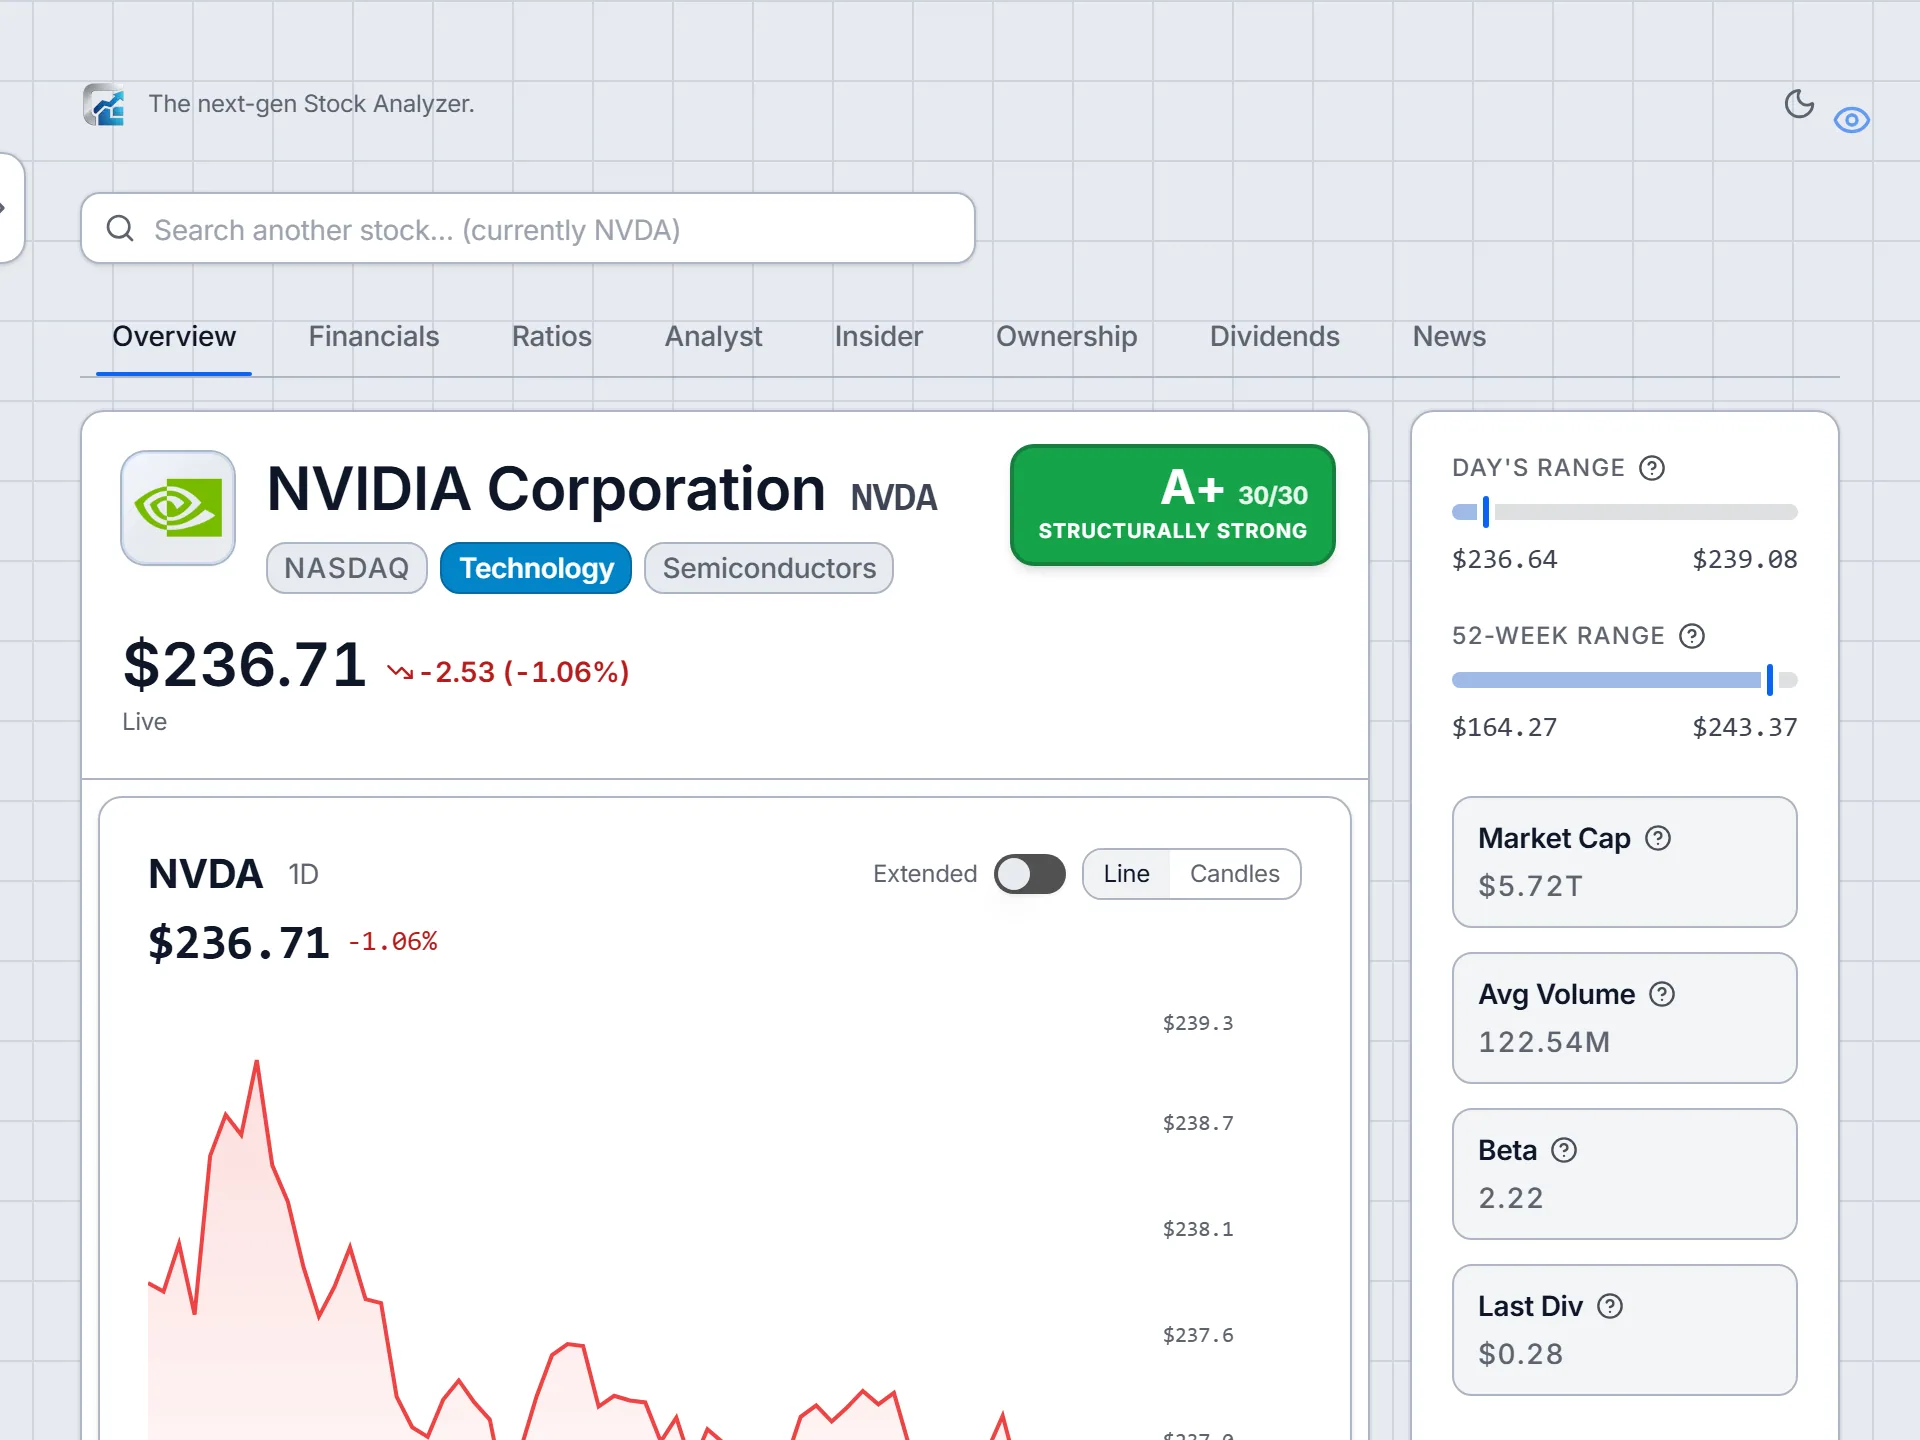
Beta: NVDA, TSLA, MSFT, AAPL, JPM, KO
Basis: as reported by our market data provider.
NVDA
Nvidia
2.22
TSLA
Tesla
1.92
MSFT
Microsoft
1.10
AAPL
Apple
1.07
JPM
JPMorgan
1.01
KO
Coca-Cola
0.32
Market beta = 1.0
Beta measures how much a stock has moved relative to the overall market. 1.0 moves with the market; above 1.0 swings harder.
How Investors Use Beta
Beta is primarily a risk management and portfolio construction tool. Here are the most common applications:
Matching portfolio risk to personal risk tolerance: An investor who cannot stomach large portfolio swings should favor low-beta stocks. A younger investor with a long time horizon who is comfortable with volatility might overweight higher-beta growth stocks to pursue greater long-run returns.
Defensive positioning before downturns: When investors believe a market correction is coming, they often rotate into low-beta, defensive sectors like utilities and consumer staples. This reduces portfolio volatility and protects capital during the downturn.
Calculating expected returns (CAPM): In academic finance, the Capital Asset Pricing Model (CAPM) uses beta to calculate the expected return of a stock, based on the relationship between risk and return. Higher beta stocks should provide higher expected returns to compensate for their additional volatility.
Portfolio beta calculation: You can calculate the overall beta of your portfolio by taking a weighted average of each holding's beta. This tells you how much volatility to expect from your portfolio relative to the market.
Important Limitations of Beta
Beta is useful but should never be the only risk measure you consider. Its limitations are significant:
Beta is backward-looking: Beta is calculated from historical price data, typically 3 to 5 years. A company's business, industry, and competitive position can change significantly over that period. Past volatility does not guarantee the same future volatility.
Beta does not capture business risk: A company with a low stock beta might still be a terrible investment if its business is deteriorating. Beta measures price volatility, not business quality. You can own a stable, low-beta stock in a company that is slowly going bankrupt.
Correlation to the market can shift: Companies that were uncorrelated with the market during normal periods can suddenly become highly correlated during financial crises when investors sell everything regardless of quality. Low beta stocks are not a guarantee of protection during severe bear markets.
Industry rotation affects beta: During sector rotations, even fundamentally stable companies can see their beta temporarily shift as large institutional investors buy or sell entire sectors.
Beta and the Investor's Time Horizon
Time horizon is one of the most important factors in how much weight to give beta in your investment decisions.
For a short-term investor (under 1-2 years), beta is highly relevant. If you need your money within a year and cannot afford a 30% drawdown, high-beta stocks are genuinely risky for you.
For a long-term investor (10+ years), beta matters much less. The stock market has recovered from every crash in history. Temporary price swings, even large ones, become less significant when measured against long holding periods. Buffett famously says he ignores the stock market's daily movements entirely because his holding period is "forever."
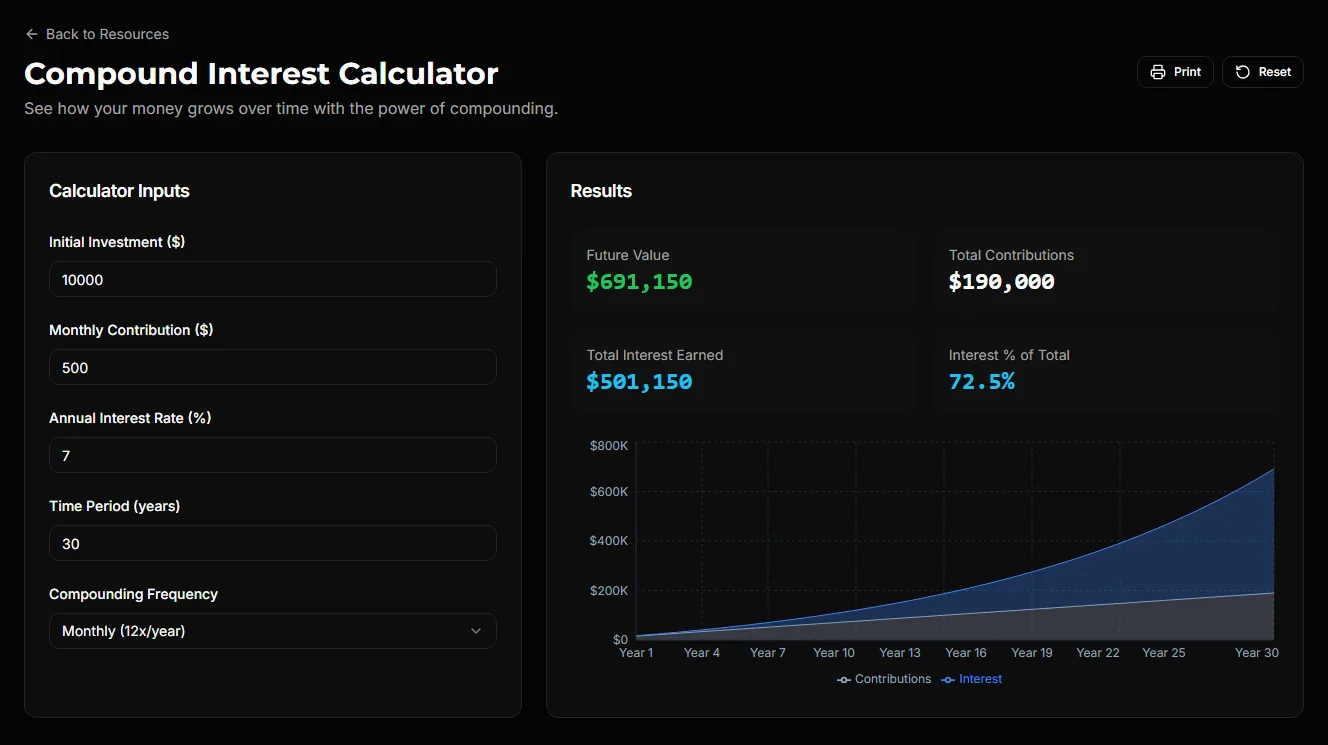
For most long-term investors, focusing on business quality, competitive position, and valuation will generate better outcomes than optimizing for beta. Use beta to understand what kind of price swings to expect, but let business fundamentals drive your actual investment decisions.
Frequently Asked Questions
What does a beta of 1.5 mean for a stock?
A beta of 1.5 means the stock has historically moved about 50% more than the overall market. If the market rises 10%, this stock would be expected to rise approximately 15%. If the market falls 10%, this stock would be expected to fall approximately 15%. Higher beta equals more potential reward and more potential loss.
Is a low beta stock safer?
A low beta stock is less volatile than the market, not necessarily safer as a business investment. A company can have a low beta stock (stable price movements) while the underlying business is deteriorating. Beta measures price volatility, not business quality or financial health.
What stocks have a beta greater than 1?
Stocks with beta above 1.0 tend to be in cyclical or high-growth sectors: technology companies, semiconductors, consumer discretionary, small-cap growth stocks, and biotech firms. These sectors are more sensitive to economic conditions and investor sentiment, causing their prices to swing more dramatically than the market average.
What stocks have a beta less than 1?
Stocks with beta below 1.0 are typically in defensive sectors: utilities, consumer staples (food, beverages, household products), healthcare services, and real estate investment trusts. These businesses provide essential goods and services that people need regardless of economic conditions, which stabilizes their revenue and stock prices.
How is beta calculated?
Beta is calculated using regression analysis comparing the stock's historical weekly or monthly returns to the market's returns over a defined period, typically 3 to 5 years. The result is the slope of the regression line. Beta of 1.0 means a perfect correlation with the market's movements; beta above 1.0 means amplified movements.