NVIDIA Stock Audit: A Perfect 30/30, With One Catch
NVIDIA scores 30/30 on the Chart Equity Stock Audit. See its growth, margins, $96.68 billion of free cash flow and the one valuation concern to watch.

On this page · 9 sections
Quick Answer: NVIDIA scores a perfect 30/30 on the Chart Equity Stock Audit. Revenue went from $26.91 billion to $215.94 billion in four years, and free cash flow reached $96.68 billion in fiscal 2026. The one concern is price: at 18.3x sales as of the close on Friday, October 9, 2026, the market already expects that growth to keep coming.
Key takeaways
- Revenue compounded at 68.3% a year from fiscal 2022 to fiscal 2026, but annual growth slowed from 114.2% to 65.5% in the latest year.
- NVIDIA kept 55.6% of fiscal 2026 revenue as net profit and turned 44.8% of it into free cash flow.
- The company ended the fiscal year with $62.56 billion of cash against $11.41 billion of debt.
- Valuation is the audit's only concern: 18.3x sales and a 29.0x trailing P/E, against a 14.4x forward P/E that rests on analysts' estimates.
- The next test is the earnings report on Tuesday, November 17, 2026.
NVIDIA closed at $239.24 on October 6, 2026, its highest close of the last 12 months. As of the close on Friday, October 9, 2026, the shares were at $229.28, about 4.2% below that peak. Then on Monday, October 12, 2026, Barron's ran a story titled "Nvidia Stock May Be Peaking. How to Spot Warning Signs for the AI Chip Maker."
So you've got a stock near its high, a "peak" headline, and an earnings report coming on Tuesday, November 17, 2026. Good time to check whether the business still backs the price. Reuters also reported on October 10 that Nvidia is in talks to invest further in Reflection AI or buy it, citing the FT.
The stock is up 21.8% over 52 weeks against 17.4% for the S&P 500, and it's about 38.8% above its lowest close of the period, $165.17 on March 30, 2026. In the chart below, look for the spring low and then the climb into October.
Chart Equity · NVDA
NVDA, last 1 year
Oct 10, 2025 to Oct 9, 2026. Change is from the close just before the chart starts.
229.28
+19.06% over 1 year
NVIDIA sells graphics, computing and networking products, including GeForce GPUs for PC gaming and the GeForce NOW cloud gaming service. At a $5.54 trillion market value, there's a lot of expectation baked in.
What does NVIDIA's 30/30 Stock Audit score mean?
It means NVIDIA earned the top mark, 5/5, on all six modules of the Chart Equity Stock Audit: revenue strength, profitability, balance sheet safety, competitive advantage, valuation versus growth and capital allocation. That's an A+ (Structurally Strong) grade, with five strengths, one concern and zero potential red flags.
A perfect score isn't a perfect stock, though. The audit's single concern is valuation, and it also flags that growth slowed sharply in the latest fiscal year.
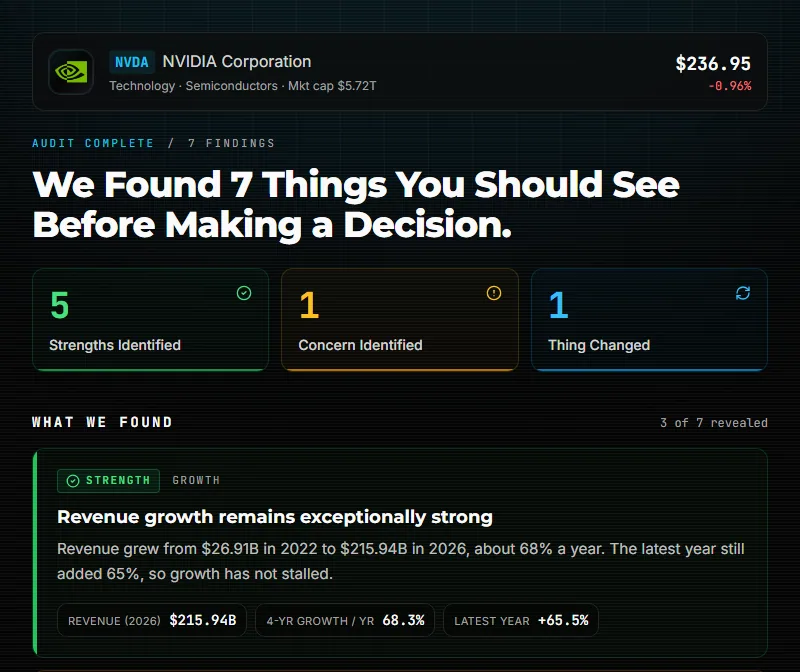
Each module's reasoning is laid out in the free NVDA Stock Audit, and our 30-minute stock audit framework explains what each check is looking for.
Is NVIDIA's growth slowing?
Yes year over year, but the latest quarter tells a different story. Fiscal 2026 revenue grew 65.5% to $215.94 billion, down from 114.2% growth the year before. But revenue in the most recent quarter grew 105.9% from a year earlier, and trailing 12-month revenue has reached $302.97 billion.
| Fiscal year | Revenue | Growth |
|---|---|---|
| FY2022 | $26.91 billion | n/a |
| FY2023 | $26.97 billion | +0.2% |
| FY2024 | $60.92 billion | +125.9% |
| FY2025 | $130.50 billion | +114.2% |
| FY2026 | $215.94 billion | +65.5% |
Fiscal 2023 was flat, and net income fell 55.2% that year. Then the curve bent hard: over four years revenue grew about 8.0x, a 68.3% compound annual rate.
Here's the thing about the slowdown. Growth of 65.5% on a $130.50 billion base still added about $85.4 billion of new revenue in one year, more than all of fiscal 2024's sales. Percentages shrink as the base grows; that's math, not a broken business.
The audit's worry is narrower, and fair. If the price still assumes the old growth rate, a slower one can hurt even while the business does fine. The revenue chart shows the shape: one flat year, then a steep staircase.
Real data · NVDA
Nvidia revenue, last 5 fiscal years
Annual, USD. Latest fiscal year ended January 25, 2026.
$215.9B
+68.3% a year since FY2022
| Fiscal year | revenue |
|---|---|
| FY2022 | $26.9B |
| FY2023 | $27.0B |
| FY2024 | $60.9B |
| FY2025 | $130.5B |
| FY2026 | $215.9B |
How profitable is NVIDIA?
Very. NVIDIA kept 55.6% of fiscal 2026 revenue as net income, or $120.07 billion, on a 71.1% gross margin. Over the trailing 12 months, net margin is even higher at 63.7%. Return on invested capital sits at 59.5%, which is why profitability and competitive advantage both score 5/5.
| Period | Gross margin | Operating margin | Net margin |
|---|---|---|---|
| FY2023 | 56.9% | 15.7% | 16.2% |
| FY2025 | 75.0% | 62.4% | 55.8% |
| FY2026 | 71.1% | 60.4% | 55.6% |
| Trailing 12 months | 74.7% | 66.2% | 63.7% |
Operating margin roughly quadrupled from fiscal 2023 as revenue scaled, and diluted EPS went from $0.38 in fiscal 2022 to $4.90 in fiscal 2026, about 12.9x. Profit growing faster than sales is the operating leverage signal the audit treats as evidence of a durable moat.
One wrinkle. Gross margin slipped from 75.0% to 71.1% in fiscal 2026. The trailing 74.7% suggests that dip didn't stick, but gross margin is where pricing pressure would show up first.
How much cash does NVIDIA actually generate?
A lot. NVIDIA produced $96.68 billion of free cash flow in fiscal 2026, or 44.8% of revenue, up from $8.13 billion in fiscal 2022. Capital spending was only $6.04 billion against $102.72 billion of operating cash flow, so nearly all the cash the business brought in was free to use.
NVIDIA spent $40.09 billion on buybacks and $974.0 million on dividends, roughly 42% of free cash flow. Diluted shares fell from 25.35 billion in fiscal 2022 to 24.51 billion, about 3.3% fewer.
Our guide to why free cash flow is the metric investors trust most covers why cash matters more than reported profit. In the chart, check whether free cash flow keeps pace with the revenue staircase.
Real data · NVDA
Nvidia free cash flow, last 5 fiscal years
Annual, USD. Latest fiscal year ended January 25, 2026.
$96.7B
+85.7% a year since FY2022
| Fiscal year | free cash flow |
|---|---|
| FY2022 | $8.1B |
| FY2023 | $3.8B |
| FY2024 | $27.0B |
| FY2025 | $60.9B |
| FY2026 | $96.7B |
How strong is NVIDIA's balance sheet?
It's a fortress. At the end of fiscal 2026, NVIDIA held $62.56 billion of cash and short-term investments against $11.41 billion of total debt, leaving $51.14 billion of net cash. Debt-to-equity was 0.07, and the trailing current ratio is 4.59, so short-term obligations are covered several times over.
One detail to watch. The latest quarterly figures put total debt at $38.86 billion against $62.47 billion of cash, a jump the summary doesn't explain. Cash still covers it with about $23.6 billion to spare.
Is NVIDIA stock expensive?
It depends on the yardstick. As of the close on Friday, October 9, 2026, NVIDIA traded at 29.0x trailing earnings and 18.3x sales, with a 2.3% free cash flow yield. On analysts' forward estimates, the P/E drops to 14.4x. That gap is the whole debate.
Trailing EPS is $7.91, and the consensus estimate for next fiscal year is $15.91, about double. If that arrives, the price looks modest against growth, which is why the PEG is 0.28 and the audit scores valuation 5/5. If it doesn't, 18.3x sales is a lot to pay, and our guide to the price-to-sales ratio explains why.
The comparison below puts NVIDIA's P/E next to other megacaps. Look for whether the market charges a premium for its growth rate, or barely any.
Real data · Compare
P/E ratio: AAPL, MSFT, NVDA, META, AMZN, GOOGL
Basis: trailing twelve months.
AAPL
Apple
39.2x
MSFT
Microsoft
29.4x
NVDA
Nvidia
26.9x
META
Meta
26.4x
AMZN
Amazon
19.8x
GOOGL
Alphabet
16.7x
P/E is share price divided by the last twelve months of earnings per share: how many dollars investors pay for $1 of profit.
Wall Street is almost unanimous. 58 analysts rate it Buy or Strong Buy, against 2 Holds and 1 Sell, and analysts' average target is $328.72. That much agreement cuts both ways: there's not much room left for upgrades.
What's the bull case and the bear case for NVIDIA?
The bull case is that revenue keeps compounding near its 68% yearly pace while margins stay above 55%, which the latest quarter's 105.9% growth supports. The bear case is that growth has already slowed from 114.2% to 65.5% annually, and at 18.3x sales even a mild slowdown could compress the valuation.
Bull case
NVIDIA has beaten the consensus EPS estimate four quarters in a row, most recently on Wednesday, August 26, 2026, with $2.22 against $2.09 expected, a 6.2% beat. Add the net cash pile and nearly 45 cents of free cash flow per revenue dollar, and there's plenty of room for error.
Bear case
The stock's beta is 2.22, so it has historically moved a bit more than twice as much as the market. At this valuation, any disappointment carries extra weight.
What would change the thesis?
Three signals would weaken it: revenue growth falling well below 68% a year, net margin slipping back from 55.6%, or gross margin settling near fiscal 2026's 71.1% instead of the trailing 74.7%.
What's next for NVIDIA stock?
NVIDIA's next earnings report is scheduled for Tuesday, November 17, 2026, per the Yahoo Finance earnings calendar. Watch whether revenue growth stays near the 105.9% pace of the latest quarter, whether net margin holds above 55.6%, and whether EPS tops the consensus for a fifth straight quarter.
The numbers back the business: every module scores 5/5. The valuation already prices in a lot of future growth, though, so November 17 is about whether growth keeps pace with the price.
Frequently Asked Questions
Why is NVIDIA's forward P/E so much lower than its trailing P/E?
The trailing P/E of 29.0x divides the $229.28 share price by the $7.91 of earnings per share NVIDIA reported over the last 12 months. The forward P/E of 14.4x uses analysts' estimate of $15.91 for the next fiscal year instead. Analysts expect earnings to roughly double. It's a forecast, not a result, so the lower multiple only holds if that estimate is met.
Does NVIDIA pay a dividend?
Yes, but it's small. The dividend yield is 0.43% as of the close on Friday, October 9, 2026, and the most recent ex-dividend date was Thursday, September 10, 2026. NVIDIA paid $974.0 million in dividends in fiscal 2026, tiny next to its buybacks. Repurchases, not dividends, are how it returns most of its cash to shareholders.
How volatile is NVIDIA stock?
More than the market. NVIDIA's 5-year monthly beta is 2.22, meaning the stock has historically moved a bit more than twice as much as the broad market in either direction. Over the last 52 weeks it traded between $164.27 and $243.37. Our guide What Is Beta? explains how to read the number.
Who owns NVIDIA stock?
Mostly institutions. About 71.4% of shares are held by institutions such as funds and pension managers, and insiders hold about 4.0%. Short interest is only 1.3% of the float, so very few investors are actively betting against the stock. That means little negative positioning, but also less fuel for a short squeeze if the shares move up quickly.
What is NVIDIA's return on equity?
NVIDIA's trailing return on equity is 110.1%, meaning it generated more than a dollar of profit for every dollar of shareholder equity over the last 12 months. That's unusual for a company with almost no debt, since heavy borrowing is what usually inflates ROE. Return on invested capital, a stricter measure that includes debt, is 59.5%.