Wow What a Stock Market Week: Nasdaq Down 2%, 9 of 11 Sectors Up
The stock market fell this week even though 9 of 11 sectors rose, as Alphabet, tech and a rough Friday dragged the Nasdaq down 2% while small caps gained.

Listen to this article
On this page · 6 sections
Quick Answer: Most of the market had a good week. Nine of 11 sectors finished higher and the Russell 2000 gained 1.29%. But Alphabet's 12.61% drop and a tech selloff on Friday, October 30, 2026 dragged the Nasdaq down 2.00% and the S&P 500 down 0.57% for the week.
Key takeaways
- The Nasdaq fell 2.00% for the week while the Russell 2000 rose 1.29%, a gap of about 3.3 percentage points.
- Only two sectors lost ground: Communication Services fell 5.32% and Technology fell 2.03%, while Health Care led with a 3.12% gain.
- Alphabet's 12.61% weekly slide was the biggest drop among the market's largest companies.
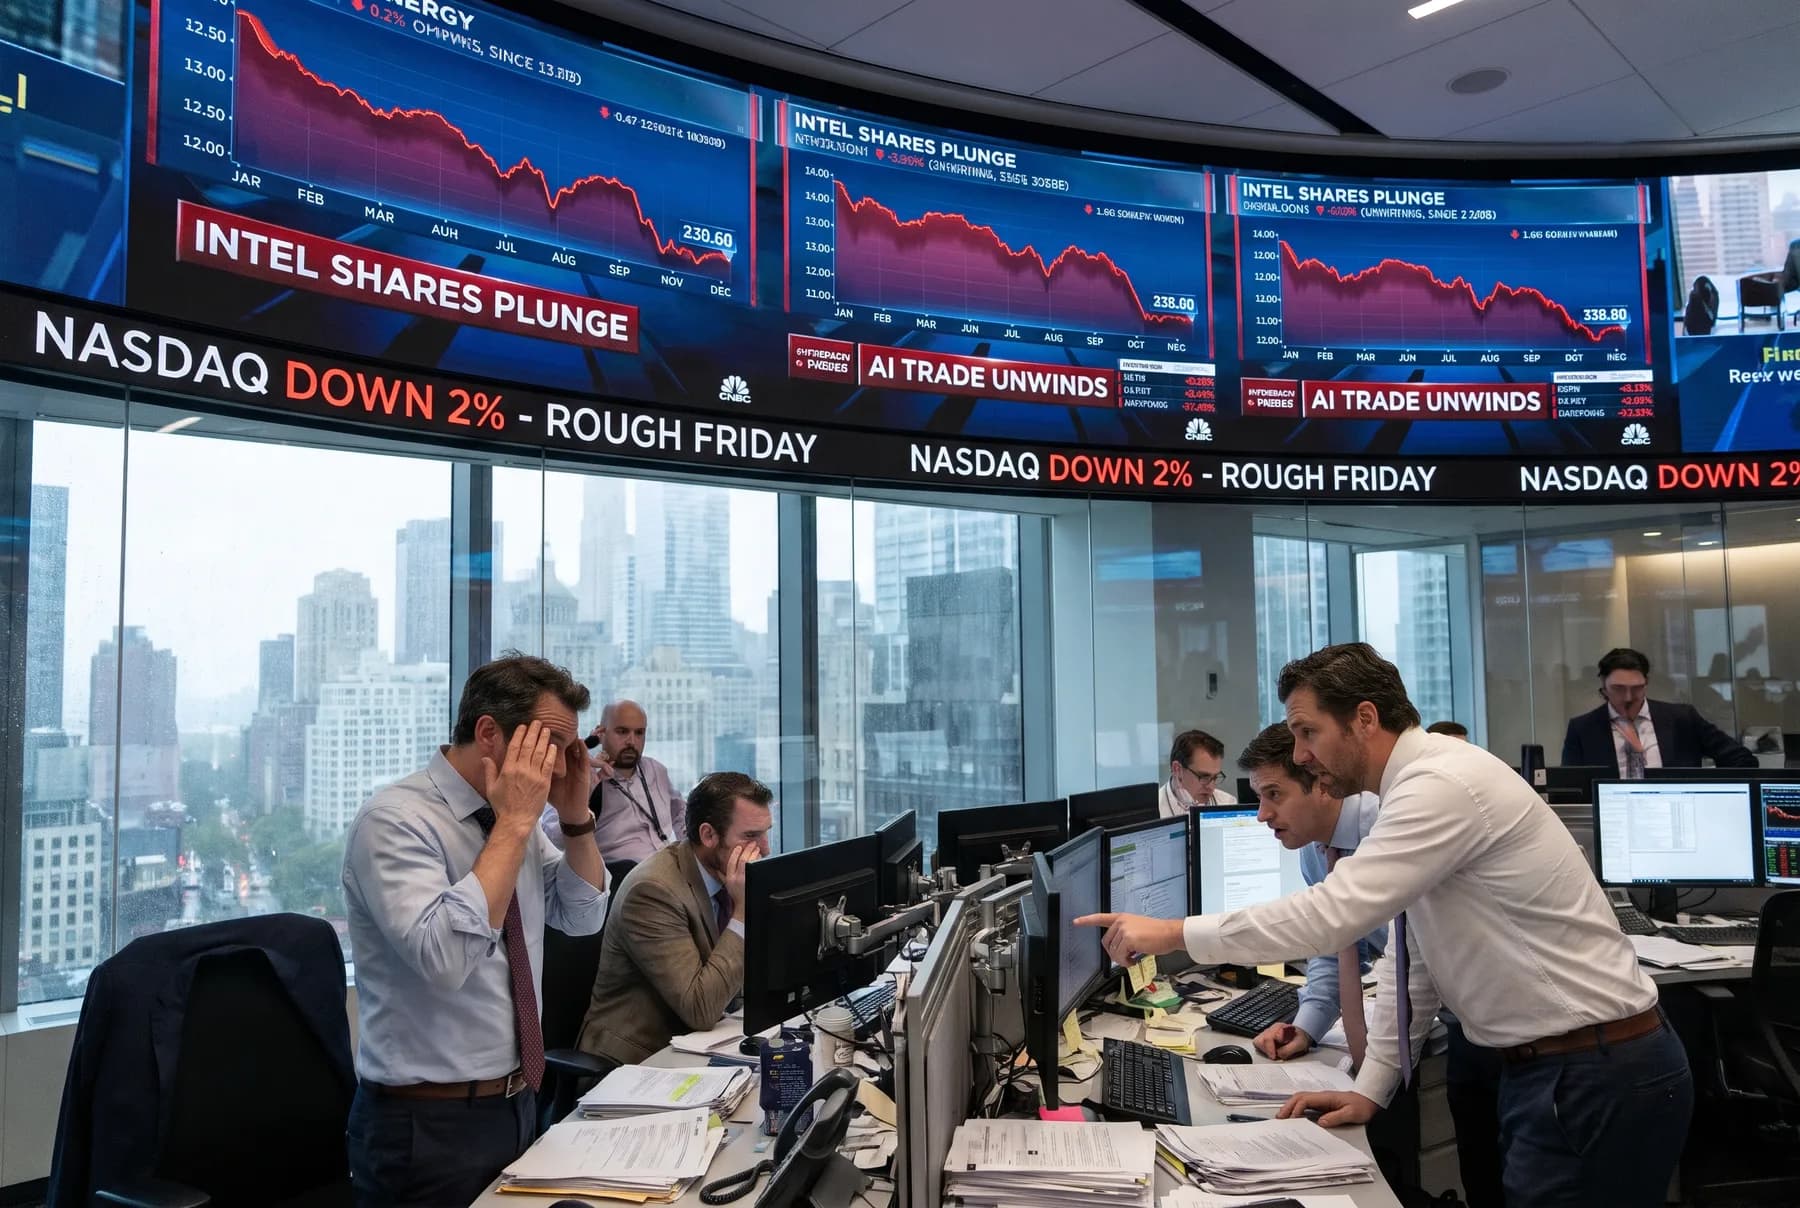
- Friday did most of the damage, with tech down 4.89% and the VIX up 12.91% to 19.42.
What happened in the stock market this week?
The average stock had a perfectly decent week. The indexes didn't. During the week of October 26 to October 30, 2026, nine of the 11 S&P sector funds finished higher, but the Nasdaq Composite still lost 2.00% and the S&P 500 slipped 0.57%, as of the close on Friday, October 30, 2026.
So what happened? A handful of the biggest names fell hard enough to outweigh everything else. The S&P 500 closed at 7,580.07, the Dow at 51,770.31 and the Nasdaq at 25,437. For a regular investor, it's a good week to check what your index fund actually holds, because "the market fell" and "most stocks fell" weren't the same thing.
On the S&P 500 chart, look for three quiet up days to start the week, then the slide that began Thursday and picked up speed on Friday.
Chart Equity · S&P 500
S&P 500, this week
Mon, Oct 26 to Fri, Oct 30. Dashed line: last week's close.
7,580.95
-0.56% for the week
Why did the Nasdaq fall while most sectors rose?
Because the losses sat in the two sectors that hold the market's largest stocks. Communication Services dropped 5.32% for the week and Technology fell 2.03%, while Health Care rose 3.12% and Materials gained 2.79%. Those winning sectors are far smaller by market value, so their gains couldn't carry the index.
Alphabet was the anchor dragging Communication Services. The stock fell 12.61% across the five sessions, to $279.84, and at a $3.44 trillion market cap a move like that shows up everywhere. The headlines in our sources don't explain Alphabet's drop specifically, so it's worth reading the company's own news before drawing conclusions.
It wasn't alone, either. Meta and Amazon also slipped on the week, though neither came close to Alphabet's slide.
Here's the full scoreboard for the week, with Friday's session next to it.
| Index or sector | Week | Friday, October 30 |
|---|---|---|
| S&P 500 | -0.57% | -1.82% |
| Nasdaq Composite | -2.00% | -2.86% |
| Dow Jones Industrial Average | -0.85% | -1.09% |
| Russell 2000 | +1.29% | -1.66% |
| Health Care (XLV) | +3.12% | +0.45% |
| Materials (XLB) | +2.79% | +0.40% |
| Utilities (XLU) | +2.04% | +0.67% |
| Consumer Discretionary (XLY) | +2.02% | -0.71% |
| Industrials (XLI) | +1.69% | -1.60% |
| Real Estate (XLRE) | +1.41% | +0.26% |
| Consumer Staples (XLP) | +1.31% | +1.41% |
| Financials (XLF) | +1.09% | -0.76% |
| Energy (XLE) | +1.00% | +1.91% |
| Technology (XLK) | -2.03% | -4.89% |
| Communication Services (XLC) | -5.32% | -1.29% |
The comparison below shows why a few companies can move an entire index. Look at how far the top names tower over everyone else. If market weighting is new to you, our guide to market capitalization and large, mid and small caps covers it.
Real data · Compare
Market capitalization: NVDA, AAPL, MSFT, GOOGL, AMZN, META
Basis: current.
NVDA
Nvidia
$5.0T
AAPL
Apple
$4.8T
MSFT
Microsoft
$3.8T
GOOGL
Alphabet
$3.4T
AMZN
Amazon
$2.7T
META
Meta
$1.4T
Market cap is share price times shares outstanding: what the market values the whole company at today.
What happened on Friday, October 30?
Friday was the day that flipped the week. The Nasdaq fell 2.86% and the Technology sector dropped 4.89% in one session, wiping out a Monday-to-Wednesday run of three straight Nasdaq gains. The Information reported on October 30 that U.S. stocks dove on AI spending fears, and that's the clearest explanation in the day's headlines.
The chip names took it hardest. Broadcom fell 5.48% and Nvidia lost 4.22% to $204.64, leaving Nvidia at a $4.94 trillion market value. Barchart wrote on October 30 that the Nasdaq was heading toward its worst day since June, and MarketWatch said the tech selloff was "shifting into overdrive."
Now look at where the money went. Energy rose 1.91% on Friday and Consumer Staples gained 1.41%, the kind of rotation into slower, steadier businesses you'd expect on a nervous day. The VIX, Wall Street's fear gauge, jumped 12.91% to 19.42. Elevated, not panicked.
On the Nasdaq chart, watch Tuesday's high and then how quickly Thursday and Friday gave it all back.
Friday's biggest single-day movers
Intel was the headline. It fell 28.58% to $65.76 and was also the most actively traded stock of the day. Barron's reported on October 30 that the plunge made Intel October's worst S&P 500 stock. Reddit fell even further, and Roblox, Illumina and Credit Acceptance all lost more than 18%.
| Stock | Friday change | Close |
|---|---|---|
| CareDx (CDNA) | +22.22% | $87.41 |
| Capri Holdings (CPRI) | +16.31% | $18.68 |
| Regeneron (REGN) | +13.33% | $927.89 |
| Reddit (RDDT) | -29.22% | $91.73 |
| Intel (INTC) | -28.58% | $65.76 |
| Roblox (RBLX) | -18.05% | $42.99 |
TradingView ran a headline on October 30 saying earnings misses rattled Wall Street, but none of our sources break down what drove each individual stock. With moves this size, that's a job for the company's own results.
What did most people miss this week?
Small caps quietly had a good week. The Russell 2000 rose 1.29% and gained ground on four of five sessions, including a 1.01% gain on Thursday, October 29, while the Nasdaq fell 1.38% that same day. Even after Friday's 1.66% drop, small caps finished well ahead of the big tech names.
Look past the screens full of red and you see more breadth. Trefis reported on October 31 that 33 S&P 500 stocks hit 52-week highs on Friday, the same day the index fell 1.82%. That's a sign the selling wasn't hitting everything equally, and some big names actually held up well.
Tesla gained 7.41% for the week, JPMorgan rose 1.65%, and Broadcom still finished up 1.37% despite its Friday slide.
So what does that mean for you? If you only watch the Nasdaq, this week looked like a selloff. If you own a mix of sectors or small caps, it may have been a winning week. The Russell chart makes that contrast easy to see: four steady steps up, then one step back.
Chart Equity · Russell 2000
Russell 2000, this week
Mon, Oct 26 to Fri, Oct 30. Dashed line: last week's close.
2,811.84
+1.29% for the week
When a stock drops 28% in a day, as Intel did, the price alone doesn't tell you whether the business changed. That's what a free Stock Audit on Intel is for. It scores the fundamentals behind the move so you're looking at revenue, margins and debt, not just the chart.
What's next for the stock market?
The week ahead opens with tech under pressure and earnings season still running. Investor's Business Daily wrote on October 31 that Apple, Palantir and the midterm elections loom over the market, and FactSet published its S&P 500 earnings season update on October 30. None of those items came with a specific date in our sources.
Here's the short list. First, check whether Friday's 4.89% tech drop keeps going or stalls. A VIX at 19.42 says traders are nervous, not running for the exits. Second, see if the rotation into Health Care, Staples and Energy holds. If you own Palantir, our Palantir Stock Audit lays out what you're paying for at its valuation.
And if a stock you own moved hard this week, run it through the audit before reacting. For a sense of how this compares with recent weeks, our wrap of the week tech fell 7.7% while staples rose 5% shows a similar split.
Related Reading
Frequently Asked Questions
Why can the S&P 500 fall when most sectors go up?
The S&P 500 is weighted by market value, so the biggest companies count the most. Apple is worth $5.03 trillion and Nvidia $4.94 trillion, far more than whole sectors like Real Estate or Materials. When a few giants fall, they can outweigh gains in hundreds of smaller stocks, which is how nine of 11 sectors rose this week while the index still slipped.
What is the Russell 2000?
The Russell 2000 tracks about two thousand smaller U.S. companies, so it's the standard gauge for small caps. It closed at 2,811.84 on Friday, October 30, 2026. Because it isn't dominated by a few tech giants, it often moves differently from the Nasdaq, and this week it finished up while the Nasdaq finished down.
What does a VIX of 19.42 mean?
The VIX measures how much volatility options traders expect in the S&P 500 over the next month. Readings in the teens are fairly calm, and the 20s signal rising nerves. Friday's close of 19.42 came after a 12.91% jump in one day, so worry went up quickly, but the level itself sits near the line between calm and anxious rather than in fear territory.
Which sectors are considered defensive?
Consumer Staples, Utilities and Health Care are the classic defensive sectors because people keep buying groceries, paying power bills and seeing doctors in any economy. On Friday all three rose, with Staples up 1.41%, Utilities up 0.67% and Health Care up 0.45%, while Technology fell 4.89%. That pattern usually shows investors trading growth for stability on a nervous day.
Why did Intel stock drop on Friday?
Intel fell 28.58% to $65.76 on Friday, October 30, 2026, and was the most actively traded stock of the session. Barron's reported that the drop made it October's worst performer in the S&P 500, but the headline doesn't give the reason. To judge whether the business itself weakened, look at the company's latest results and fundamentals rather than the price move alone.