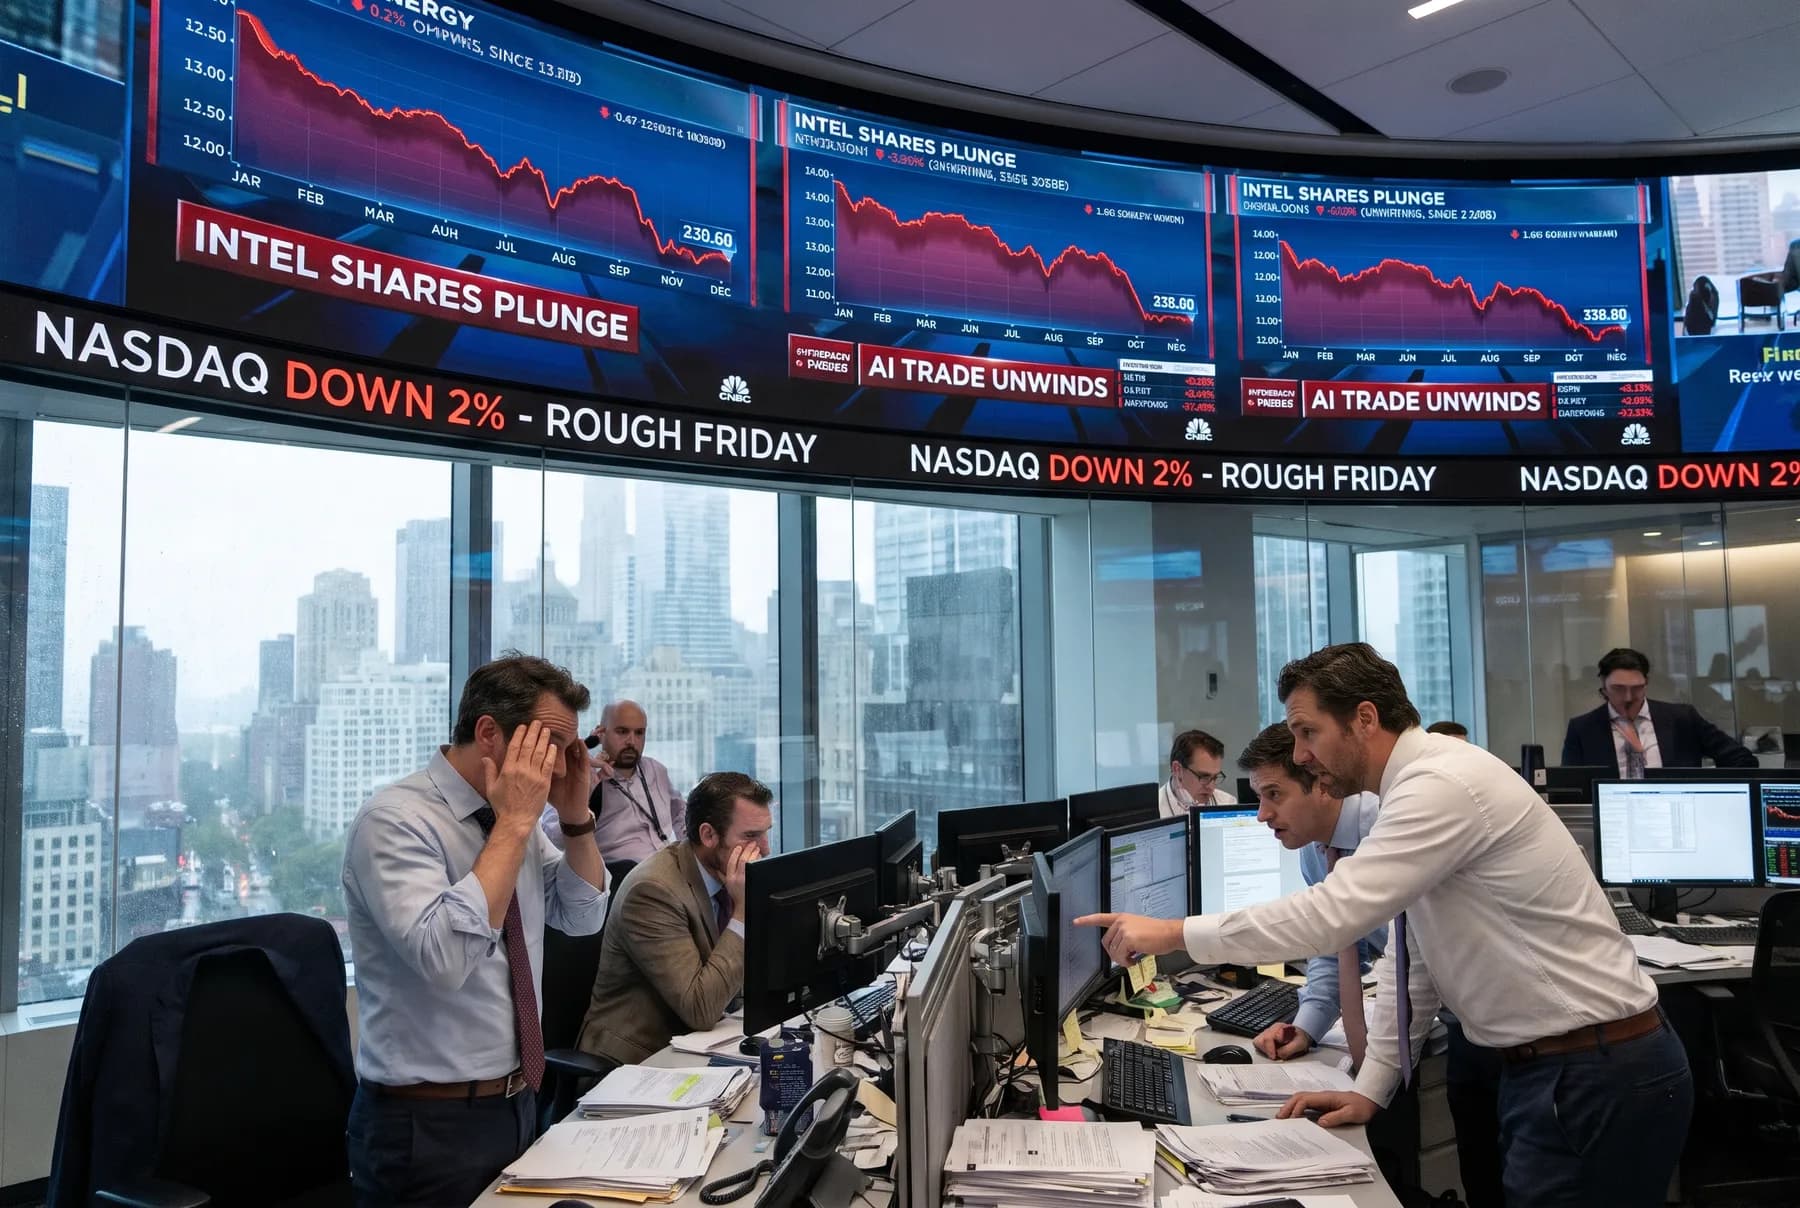
Stock Market Week: Nvidia Down 12.8%
The stock market week saw the S&P 500 gain 2.92% and energy lead all 11 sectors, while Nvidia fell 12.75% and Broadcom rose 18.16%. Here's what the split means.

Listen to this article
On this page · 8 sections
Quick Answer: So far this week, through the close on Thursday, November 12, 2026, the S&P 500 rose 2.92% in four sessions to 7,561.67. Every one of the 11 sector funds finished higher, led by energy at 5.42%. The AI chip trade split in two, though: Nvidia fell 12.75% while Broadcom gained 18.16%.
Key takeaways
- The S&P 500 gained 2.92% in four sessions, and Monday, November 9, 2026 did most of the work with a 2.35% jump.
- Energy led the sector funds at +5.42%, ahead of industrials and communication services, while materials barely moved.
- Nvidia dropped 12.75% for the week while Broadcom rose 18.16%, so "the AI trade" didn't move as one thing.
- Small caps opened strong but faded, with the Russell 2000 finishing up only 1.32% after a 3.15% Monday.
- Nvidia was the most-researched ticker on the Chart Equity Stock Analyzer, followed by Micron and Apple.
The most-researched stock on Chart Equity had an ugly week while the market around it had a good one. So far this week, from Monday, November 9, 2026 through the close on Thursday, November 12, 2026, the S&P 500 climbed 2.92% in four sessions. Nvidia fell 12.75% from the November 6 close through Friday's close on November 13. Broadcom, the other chip giant, went up 18.16%.
Same industry. Opposite weeks. That's the thread worth pulling.
How did the stock market do this week?
It was a good week for stocks. The S&P 500 gained 2.92% over four sessions and stood at 7,561.67 as of the close on Thursday, November 12, 2026. All 11 sector funds finished the week in the green, and RealMoney Pro reported on November 14 that stocks notched their best week since August.
The Nasdaq Composite finished up 2.27% and the Dow added 2.07%, both measured through Friday's close. That's a broad rally, not one carried by a handful of names. If you own a plain index fund, this was the kind of week you barely had to think about.
Watch the shape in the chart below: a big Monday, a small Tuesday dip, another push on Wednesday, then a soft Thursday.
Chart Equity · S&P 500
S&P 500, this week
Mon, Nov 9 to Fri, Nov 13. Dashed line: last week's close.
7,561.67
+2.51% for the week
Here's the thing, though. A broad rally can hide a lot of churn underneath, and this one did.
Why did Nvidia fall while Broadcom rose?
Nobody in the headlines spells out the cause of the split. Nvidia lost 12.75% for the week and Broadcom gained 18.16%, a gap of about 31 percentage points between two stocks most people lump together as "AI chips." The headlines describe a chip selloff but don't say why these two moved opposite ways.
What the headlines do cover is the selling. Moomoo reported on November 13 that Cisco and Nvidia share losses led the Dow's nearly 150-point fall. A day later, Bastille Post ran "U.S. stocks close mixed as chip sell-off deepens." So the pressure on chips was real and reported. The reason one giant fell and another rallied isn't, which is its own kind of signal: the market is starting to sort the AI names instead of buying the whole basket.
Look at Nvidia's week in the chart: check whether the damage came in one hit or spread across several sessions.
Chart Equity · NVDA
NVDA, this week
Mon, Nov 9 to Fri, Nov 13. Dashed line: last week's close.
162.85
-12.75% for the week
Even Broadcom didn't escape the late selling. It fell 4.76% in the latest session, and Nvidia slipped 2.01% in the same session, so both took a hit as the week closed out. If you want the longer view on whether the demand side still holds up, our breakdown of why the AI demand data still looks strong is a good companion read.
Why didn't Nvidia's drop sink the index?
Because the rest of the mega caps carried the load. Apple rose 4.06%, Meta gained 5.17% and Tesla added 8.93% for the week. Microsoft was the only other big name in the red, down 1.27%. When the biggest companies split this way, the index can rise even with its most famous chip stock down double digits.
Real data · Compare
Market capitalization: AAPL, NVDA, MSFT, GOOGL, AVGO, META
Basis: current.
AAPL
Apple
$5.2T
NVDA
Nvidia
$3.9T
MSFT
Microsoft
$3.9T
GOOGL
Alphabet
$3.6T
AVGO
AVGO
$1.7T
META
Meta
$1.6T
Market cap is share price times shares outstanding: what the market values the whole company at today.
The comparison above shows how the giants stack up by size. Keep in mind that Apple, at $5.18 trillion, is bigger than Nvidia at $3.93 trillion, so Apple's gain did a lot of the cushioning.
Which sectors led the market this week?
Energy led everything, up 5.42% for the week. Industrials came second at 3.76% and communication services third at 3.72%. Technology rose 3.36% despite Nvidia's slide. Every sector was up, but the spread from first to last was almost five points.
Energy beating tech in a week this strong is the part most people missed. HDFC Sky's weekly wrap from November 14 points to an oil slump in its link, but the title only says the Dow, S&P 500 and Nasdaq rose, so that doesn't explain energy's lead. For a regular investor, the point is simpler: diversification across sectors did its job.
| Index or sector | Week | Latest session |
|---|---|---|
| S&P 500 | +2.92% | n/a |
| Nasdaq Composite | +2.27% | n/a |
| Dow Jones Industrial Average | +2.07% | +0.10% |
| Russell 2000 | +1.32% | -0.31% |
| Energy (XLE) | +5.42% | +0.98% |
| Industrials (XLI) | +3.76% | n/a |
| Communication Services (XLC) | +3.72% | +1.05% |
| Technology (XLK) | +3.36% | -2.01% |
| Financials (XLF) | +2.66% | n/a |
| Consumer Staples (XLP) | +2.52% | +1.42% |
| Health Care (XLV) | +2.19% | +0.54% |
| Utilities (XLU) | +2.11% | n/a |
| Consumer Discretionary (XLY) | +2.04% | n/a |
| Real Estate (XLRE) | n/a | n/a |
| Materials (XLB) | +0.54% | -0.21% |
The S&P 500's weekly figure covers four sessions through Thursday. The other weekly figures run through Friday, November 13.
What moved the most in the latest session?
Chips took the hit. Technology fell 2.01% in the latest session while consumer staples rose 1.42%, the defensive corner beating tech by more than three points in one day. Money moved out of AI hardware and into the boring stuff, and the names closest to the AI build-out felt it most.
| Stock | Latest session |
|---|---|
| AMD | -8.75% |
| Nebius | -9.92% |
| CoreWeave | -6.13% |
That's a much steeper drop than the sector's, so the selling wasn't spread evenly. It landed hardest on AI hardware.
AMD has been here recently. Our piece on why AMD stock fell 17% on Thursday covers that earlier drop, and this session's slide adds another chapter.
On the upside, Liftoff Mobile jumped 30.63% and Modine Manufacturing gained 27.86%. Nu Holdings rose 11.75% and was also one of the most actively traded names. Cerebras Systems added 11.22%, a chip name going the other way on a bad day for chips. Investor's Business Daily's November 13 market report mentions Cerebras earnings in its link, but its title doesn't explain the move, so treat that as a lead to check, not a cause.
Which day changed the week?
Monday, November 9, 2026 made the week. The S&P 500 jumped 2.35% that day, its best session, and the Russell 2000 gained 3.15%. Without Monday, the S&P's four-session gain would have been well under one percent. Most of the week's return showed up in the first six and a half hours.
Small caps tell the cautionary half. The Russell 2000 fell 1.66% on Thursday, November 12, 2026, its worst session, and finished the week up just 1.32%. It gave back more than half of Monday's gain. The chart shows how quickly that Monday lead faded.
Chart Equity · Russell 2000
Russell 2000, this week
Mon, Nov 9 to Fri, Nov 13. Dashed line: last week's close.
2,790.49
+1.32% for the week
If you only checked your account on Friday, you'd have seen a decent week. The path to get there was choppier, which is why the VIX ended at 19.3, up 3.21% in the latest session. If you want to understand how much a stock tends to swing with the market, our guide on what beta tells you about volatility covers it.
What were Chart Equity members researching?
Nvidia was the most-viewed ticker on the Chart Equity Stock Analyzer this week, followed by Micron at second and Apple at third. That lines up with the week: Nvidia had the biggest drop among the mega caps, and Apple carried the index. Micron, a memory chipmaker, fits the chip theme.
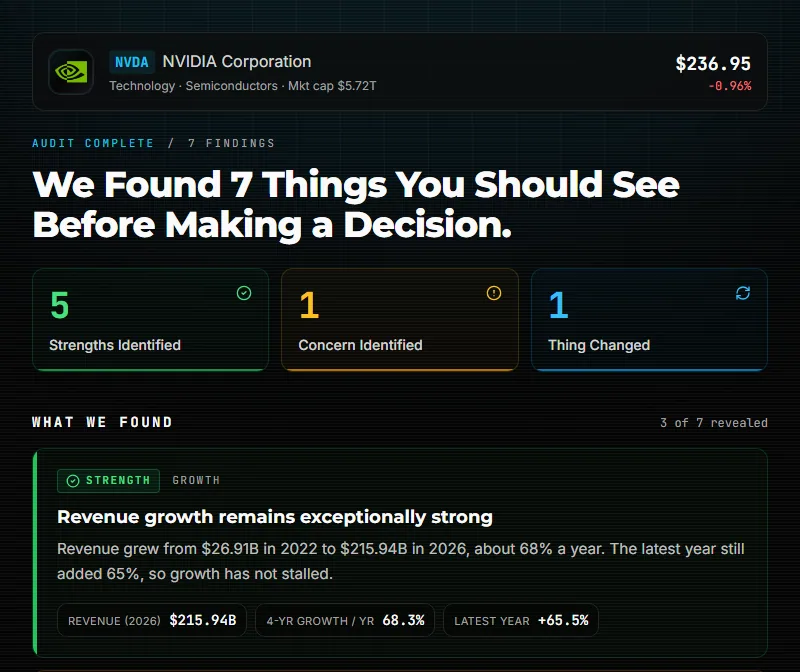
When a stock drops 12.75% in a week, the useful question isn't "is this the bottom?" It's whether the business underneath changed or just the mood. A price move tells you what people felt. Revenue, margins, cash flow and debt tell you what the company is actually doing. You can run that check on Nvidia with a free Stock Audit, and our Nvidia Stock Audit deep dive walks through how it scores.
What's next?
None of the headlines this week name a dated catalyst for the week ahead, so the short list comes down to the process and two things to watch. The first is rates: RealMoney Pro reported on November 14 that the 2-year Treasury yield jumped the most since 2024, even as stocks had their best week since August.
The second is concentration. Yahoo Finance ran a piece on November 14 headlined "65% of the S&P Is Basically AI," quoting Steve Eisman. You don't have to agree with the number to see the point: when chips split like this, your index fund's mood depends on which AI names win.
The process point: if a name you own moved hard this week, whether it's Nvidia, AMD or Broadcom, pull up the fundamentals before reacting to the price. A 30-minute audit beats a five-minute panic.
Frequently Asked Questions
How can the S&P 500 rise when Nvidia falls?
The S&P 500 is weighted by market value, so no single stock decides the direction. Nvidia is worth $3.93 trillion, but Apple is worth $5.18 trillion and Microsoft $3.89 trillion, and hundreds of other companies count too. When Apple, Alphabet, Meta and most sectors rise together, they can outweigh even a double-digit drop in one giant.
What does a VIX of 19.3 mean?
The VIX measures how much volatility options traders expect in the S&P 500 over the next month. It's often called the market's fear gauge. A reading of 19.3 sits in a middle zone: not calm, not panicked. Its rise of 3.21% in the latest session suggests traders paid a bit more for protection as chip stocks sold off.
What is a sector ETF like XLE?
A sector ETF holds a basket of companies from one part of the economy, so you can track or own the whole group in one trade. XLE covers energy, XLK technology and XLP consumer staples. Comparing them is a quick way to see where money is flowing. This week XLE's 5.42% gain beat XLK's 3.36%.
Why do small caps swing more than large caps?
Smaller companies tend to have less diversified revenue, thinner trading and more sensitivity to borrowing costs, so their shares often move more in both directions. The Russell 2000 tracks them. This week it had both the biggest gain of the major indexes on Monday, at 3.15%, and the biggest drop on Thursday, at 1.66%.